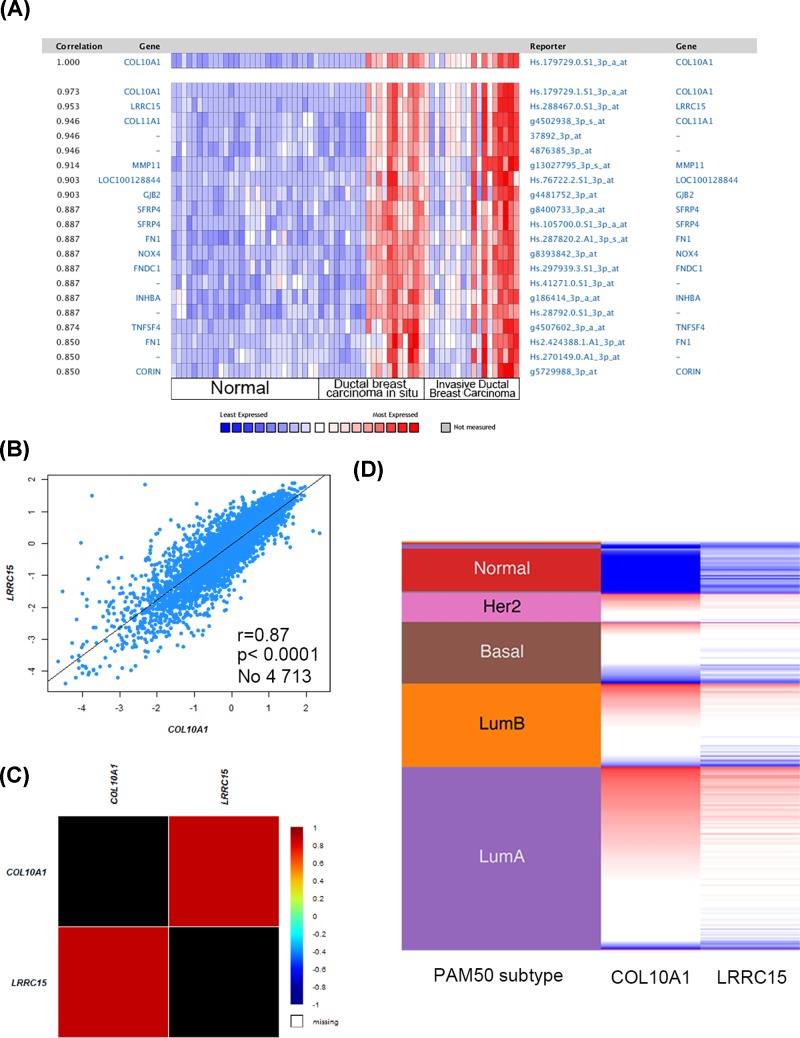
Figure 4. Co-expression analysis of COL10A1.
(A) Co-expression profile of COL10A1 identified using the Oncomine database. (B,C) Showed the correlation between COL10A1 and LRRC15 expression in breast cancer by the bc-GenExMiner software. (D) Heat map of COL10A1 and LRRC15 expression across PAM50 breast cancer subtypes in the TCGA database obtained from the UCSC Xena web-based tool.

