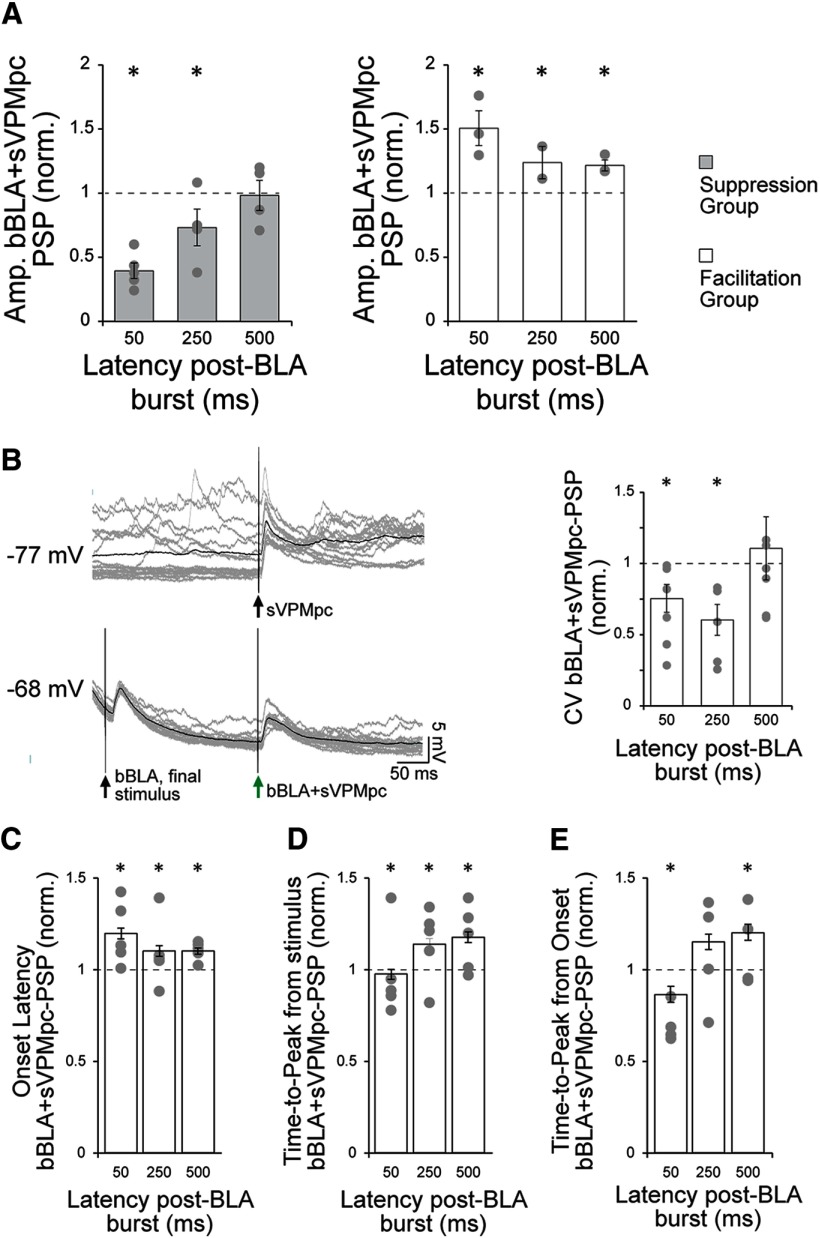
Figure 7.
BLA bursts modulate VPMpc-PSP amplitude and temporal dynamics. A, For each cell and post-BLA burst latency tested, the average amplitude of the evoked VPMpc-PSP under baseline conditions (sVPMpc) was used to normalize the amplitude of the evoked post-burst PSP (bBLA+VPMpc). These normalized amplitudes were then averaged across cells with the same response pattern and plotted. Left panel, Group of n = 5/8 cells (as in Fig. 6A), where the VPMpc-PSP was depressed following a BLA burst. Each cell’s mean, normalized PSP amplitude (gray circles) and the group mean ± SEM (light gray bars) is shown for each latency tested. Asterisks indicate p < 0.01. Right panel, Group of n = 3/8 cells (as in Fig. 6B), where the VPMpc-PSP was enhanced following a BLA burst. Each cell’s mean, normalized PSP amplitude (gray circles) and the group mean ± SEM (white bars) is shown for each latency tested. Asterisks indicate p < 0.01. y-axis: normalized bBLA+sVPMpc-PSP amplitude; x-axis: post-BLA burst latency (ms). B, left panel, Representative trace from a GC cell recorded 4.8 mm ventral from the pia to VPMpc stimulation under control conditions (sVPMpc; top trace) and 250 ms following a BLA burst (bBLA+sVPMpc, bottom trace). Gray traces: 16 overlaid trials. Black trace: Average of 16 trials. Right panel, CV was calculated from the peak PSP amplitudes evoked by VPMpc stimulation at post-BLA burst latencies of 50, 250, and 500 ms and normalized to the CV calculated under baseline conditions. Each cell’s mean, normalized CV (n = 8; gray circles) and group mean ±SEM (white bars) are shown. Asterisks indicate p < 0.05. y-axis: normalized CV for bBLA+sVPMpc-PSP; x-axis: post-BLA burst latency (ms). C, VPMpc-PSP onset latency was measured under baseline conditions (sVPMpc) and following a BLA burst (bBLA+sVPMpc) at latencies of 50, 250, and 500 ms. The PSP onset latency was significantly increased at each post-burst interval as compared with baseline, with the strongest effect at 50 ms. Asterisks indicate p < 0.05. y-axis: normalized bBLA+sVPMpc-PSP onset latency; x-axis: post-BLA burst latency (ms). D, VPMpc-PSP time-to-peak was measured from stimulus onset under baseline conditions (sVPMpc) and following a BLA burst (bBLA+sVPMpc) at latencies of 50, 250, and 500 ms. The PSP time-to-peak was significantly smaller at a post-burst latency of 50 ms and larger at 250- and 500-ms latencies. Asterisks indicate p < 0.05. y-axis: normalized bBLA+sVPMpc-PSP time-to-peak from stimulus onset; x-axis: post-BLA burst latency (ms). E, VPMpc-PSP time-to-peak was measured from PSP onset under baseline conditions (sVPMpc) and following a BLA burst (bBLA+sVPMpc) at latencies of 50, 250, and 500 ms. The PSP time-to-peak was significantly smaller at a post-burst latency of 50 ms and larger at 500-ms latency. Asterisks indicate p < 0.05. y-axis: normalized bBLA+sVPMpc-PSP time-to-peak from PSP onset; x-axis: post-BLA burst latency (ms).

