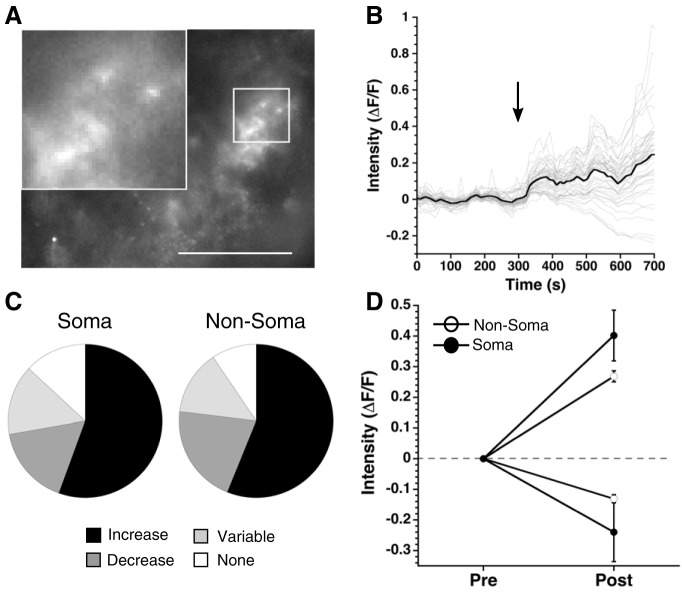
Figure 8.
Activation of Gq DREADDs increases intracellular Ca2+ in astrocytes. A, Representative SCN slice of a GFAP-Cre+ mouse injected with Gq DREADD and GCaMP6. Scale bar is 50 μm, images taken at 40× and the inserts magnified 120×. B, Fluorescent intensity over time of the slice shown in A. Black arrow indicates the CNO (10 μM) application. Gray lines are individual regions, the black line is the average response of regions. C, Pie charts depict the percentage of regions that increase (black), decrease (dark gray), have a variable response (light gray), or do not respond (white) to CNO treatment across all experiments. D, Average fluorescent intensity before and after CNO application displayed as mean ± SEM for soma and non-soma regions.

