
FIGURE 2.
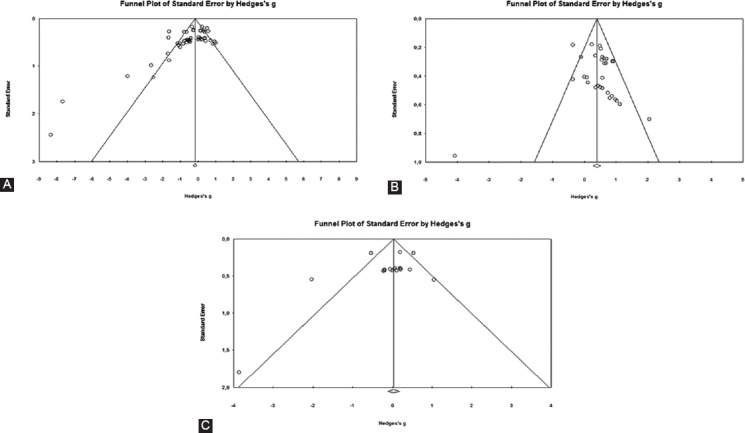
Funnel plots of the standard differences in means vs. standard errors for (A) maximal voluntary strength, (B) voluntary muscle activation and (C) cross-sectional area of the quadriceps muscle.
Official websites use .gov
A
.gov website belongs to an official
government organization in the United States.
Secure .gov websites use HTTPS
A lock (
) or https:// means you've safely
connected to the .gov website. Share sensitive
information only on official, secure websites.
Funnel plots of the standard differences in means vs. standard errors for (A) maximal voluntary strength, (B) voluntary muscle activation and (C) cross-sectional area of the quadriceps muscle.