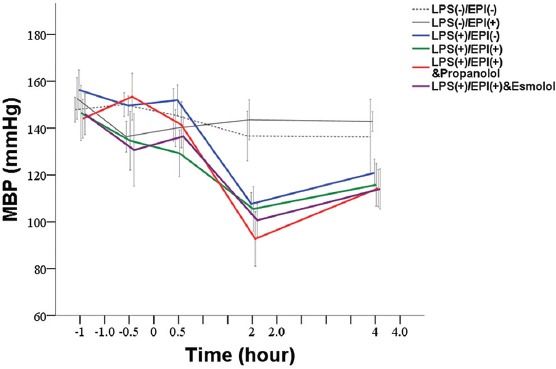
FIGURE 4.

Changes in mean blood pressure in LPS-induced rat sepsis model, and in relation to EPI and propranolol/esmolol administration. A total of 36 male Sprague-Dawley rats were randomized into two control groups and four experimental groups of six animals each. Black dotted line denotes saline placebo group: LPS(-), EPI(-). Black solid line means EPI control group: LPS(-), EPI(+). Blue solid line represents Group A: LPS (+), EPI (-); Red solid line represents Group B: LPS(+), EPI(+), + propranolol. Green solid line represents Group C: LPS (+), EPI(+); Purple solid line represents Group D: LPS(+), EPI(+), + esmolol. EPI: Epinephrine; LPS: Lipopolysaccharide; MBP: Mean blood pressure.
