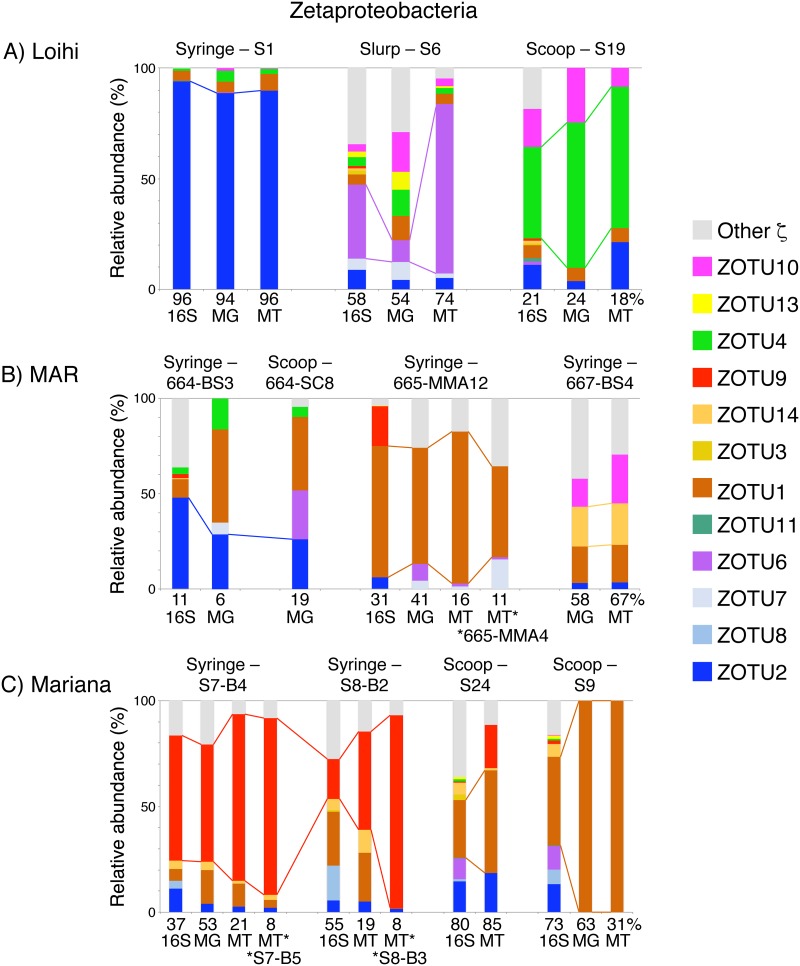
FIG 2.
Comparison of 16S rRNA gene, metagenome (MG), and metatranscriptome (MT) relative abundance for the Zetaproteobacteria from various mats at Loihi Seamount (A), the Mid-Atlantic Ridge (B), and Mariana Backarc (C). The relative abundance of the most abundant Zetaproteobacteria operational taxonomic unit (ZOTU) by 16S rRNA gene is tracked across similar Fe mat samples from the same region. Asterisks denote MTs from different samples that were mapped to the indicated MG. Percentages are shown at the bottom of each bar graph to indicate the relative proportion of Zetaproteobacteria in each sample (see Fig. S4).

