
FIG 3.
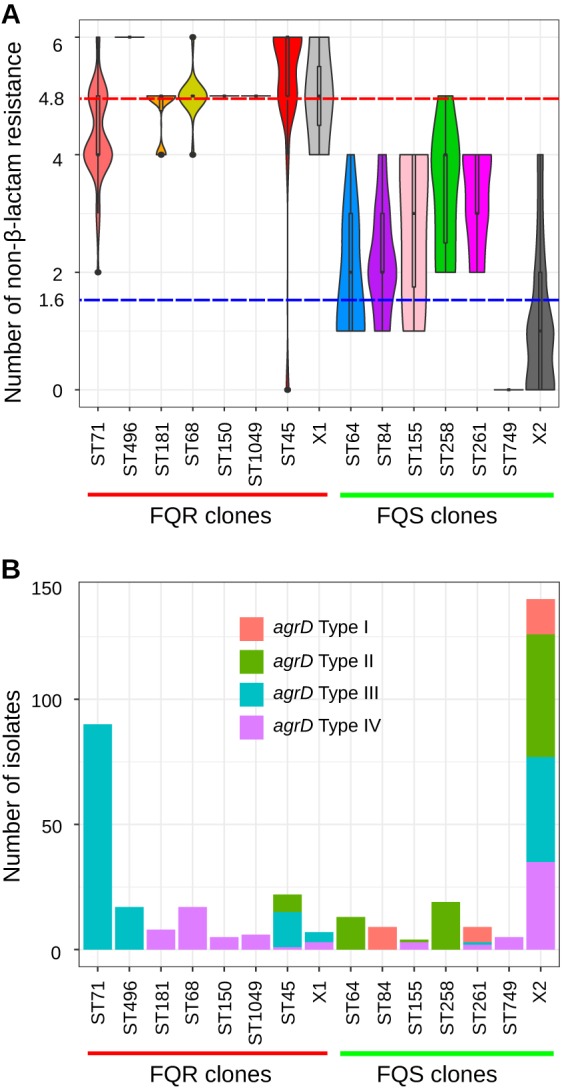
Analysis of antibiotic resistance and agrD genes. (A) Violin plot showing the distribution of non-β-lactam resistance genes. The red and blue dashed horizontal lines indicate the mean numbers of non-β-lactam resistance genes in clones belonging to FQR (mean = 4.8) and FQS (mean = 1.6), respectively. (B) Distribution of agrD type I to IV across different lineages of S. pseudintermedius.