
FIG 5.
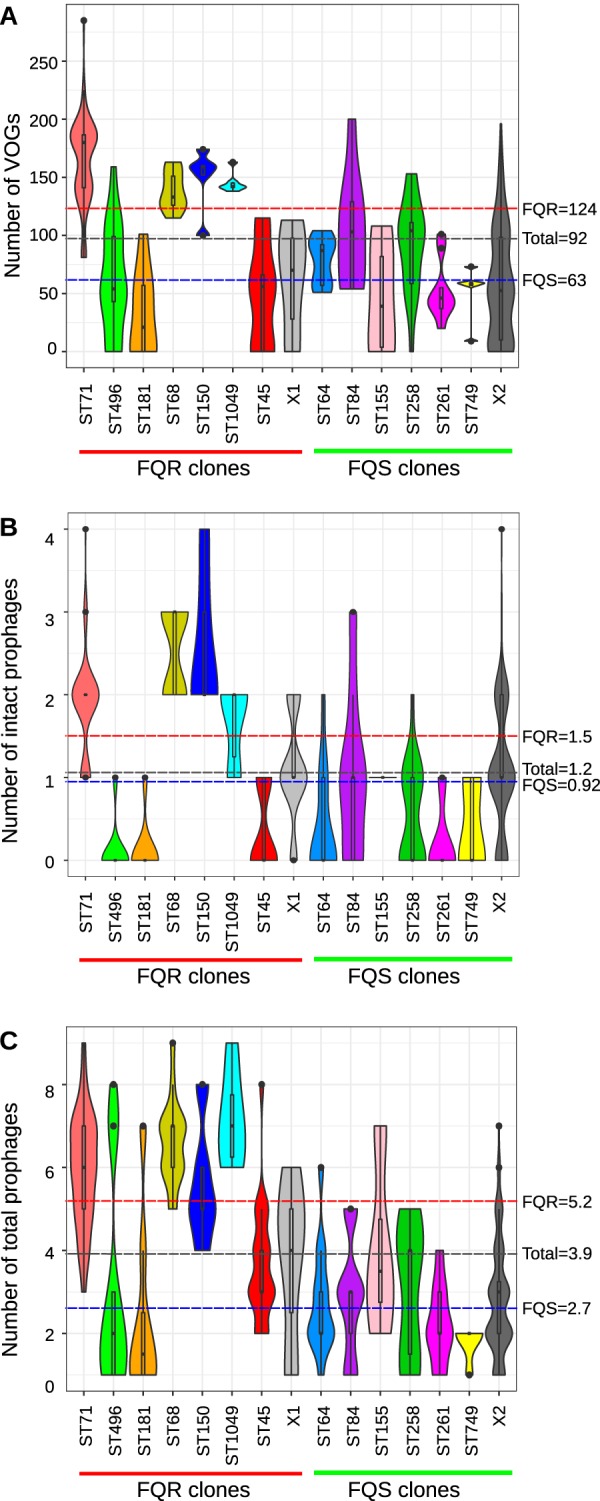
Prophage content analysis. Violin plots showing the number of prophages identified in S. pseudintermedius isolates. (A) Prokaryotic virus orthologous groups (pVOGs) identified using PHIGARO. (B) Intact prophages identified using PHASTER. (C) Total prophages (combining intact, incomplete, and questionable) across different lineages of S. pseudintermedius identified using PHASTER. The dashed horizontal lines on each plot indicate the mean values in FQR (red), FQS (blue), and total (gray) isolates.