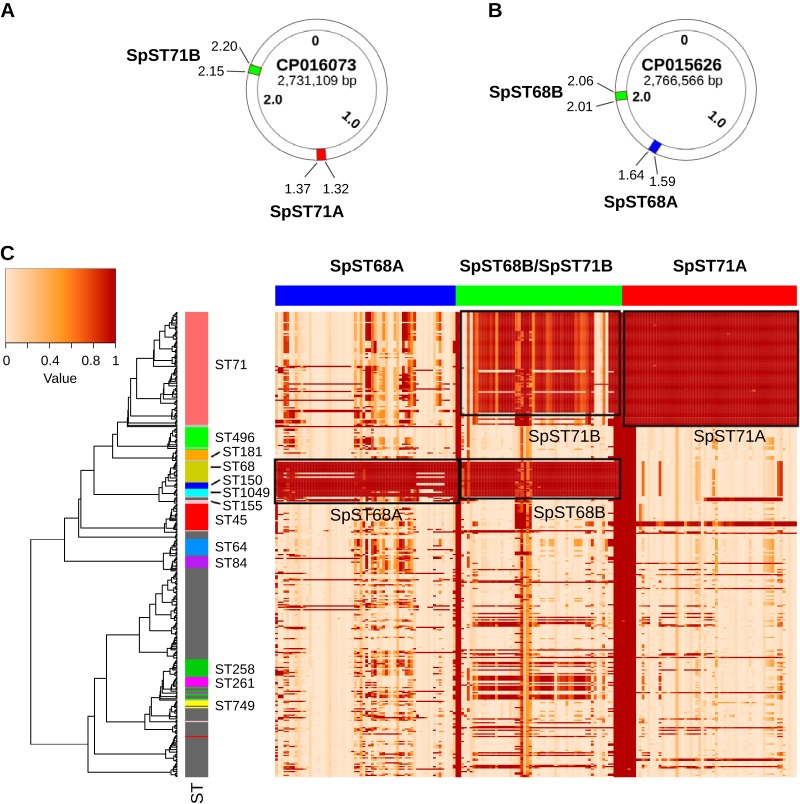
FIG 6.
Distribution of ST71- and ST68-specific prophages. Circular maps showing the genomic coordinates (in Mb) of the intact prophages. (A) SpST71A and SpST71B in a representative ST71 genome. (B) SpST68A and SpST68B in a representative ST68 genome. (C) A heat map showing the distribution of four intact prophages across 371 genomes. The rows in the heat map correspond to isolates, and columns correspond to all the ORFs (genes) within the prophages. The color in the heat map is based on the BSR value (range 0 to 1) obtained by the LS-BSR analysis, with a darker color corresponding to prophage gene presence, and a lighter color corresponding to prophage gene absence. As shown, the SpST71A and SpST71B prophages are predominantly present in the ST71 lineage, whereas SpST68A and SpST68B are predominantly present in the ST68, ST150, ST155, and ST1049 lineages. The SpST71B and SpST68B are closely related prophages with ∼93% nucleotide sequence identity, which is also reflected in this gene presence/absence matrix.

