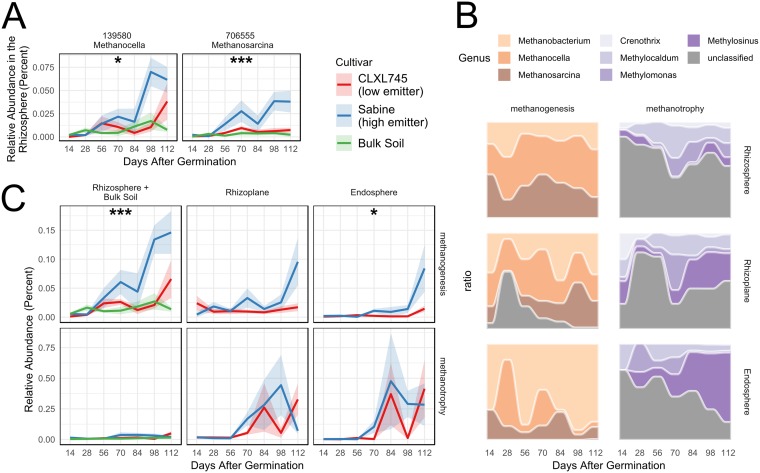
FIG 2.
Cultivars vary significantly in methanogen abundances in the rhizosphere but not methanotroph abundance in any compartment. (A) Seasonal trends of OTUs 139580 and 706555, the two methanogens in the list of cultivar-sensitive OTUs detected in the rhizosphere. The colored line indicates the average relative abundance, and the colored ribbon indicates the standard error (n = 6 to 8). Asterisks indicate that the OTU was significant in the likelihood ratio test (*, P < 0.05; **, P < 0.01; ***, P < 0.001). Statistical comparisons were only performed between Sabine and CLXL745 samples, and the bulk soil is shown for reference. (B) Total relative abundances of methanogenic archaea and methanotrophic bacteria as defined by FAPROTAX. The shaded colored ribbon indicates the standard error (n = 6 to 8). Asterisks indicate that the cultivar term was significant in the ANOVA on variance-stabilized data (*, P < 0.05; **, P < 0.01; ***, P < 0.001). Statistical comparisons were only performed between Sabine and CLXL745 samples. (C) Seasonal shifts in methanogen and methanotroph compositions within each compartment. Color indicates the average relative proportion of methanogens or methanotrophs across both cultivars.

