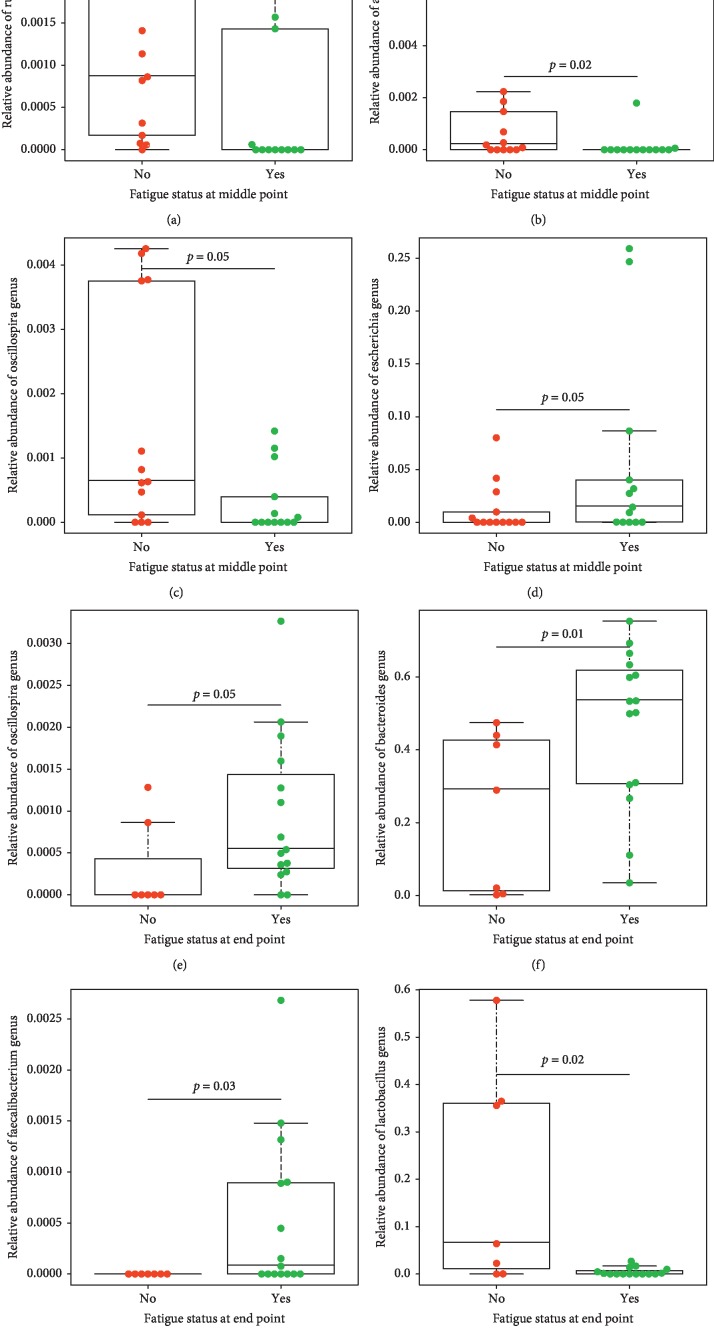
Figure 3.
Boxplots showing the relative abundance of selected genera between fatigued and nonfatigued groups (No/= nonfatigued; Yes = fatigued) based on Mann–Whitney U test in fecal samples at the middle of treatment ((a) Ruminococcus, (b) Akkermansia, (c) Oscillospira, and (d) Escherichia genus) and at the end of treatment ((e) Oscillospira, (f) Bacteroides, (g) Faecalibacterium, and (h) Lactobacillaceae) relative to baseline, pre-CRT. Middle of treatment (fatigued n = 13; nonfatigued n = 13); end of treatment (fatigued n = 15; nonfatigued n = 7).

