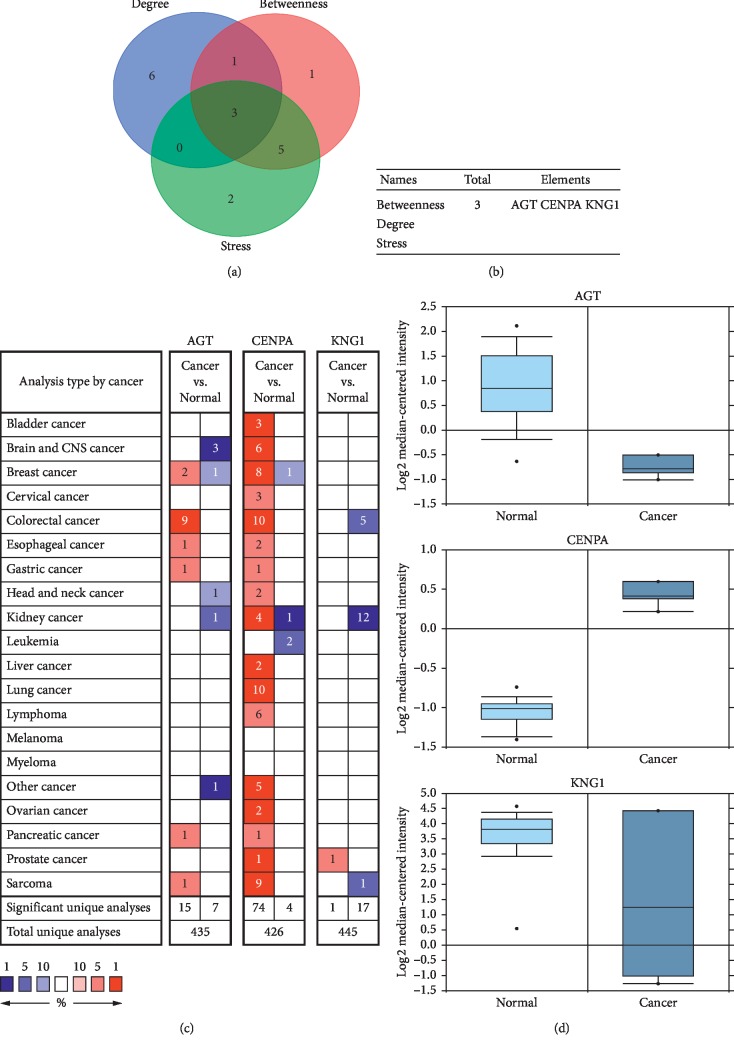
Figure 3.
Identification and relative expression of hub genes in ChRCC. (a, b) Three hub genes were selected by overlapping the top ten genes based on three ranked methods, including the degree, betweenness centrality, and Stress. (c) An overview of mRNA levels of hub genes in a variety of cancers based on Oncomine. The numbers in colored cells show the quantities of datasets with statistically significant mRNA overexpression (red) or underexpression (blue) of target genes. Cell color was determined by the best gene rank percentile for the analysis within the cells. The threshold was set as P < 0.05. (d) Relative expression of hub genes between ChRCC and normal samples. The threshold was set as P < 0.05.

