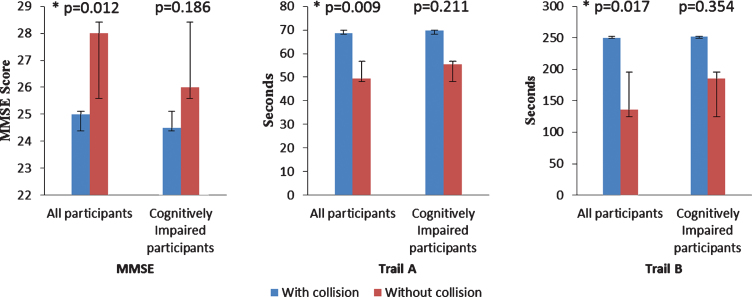
Fig.2.
Comparing cognitive measures medians using Man Whitney U analysis between participants with and without predicted collision. In each figure, the left two columns show comparison among all participants and the right two columns show the comparison among cognitively impaired drivers. All three measures showed significant difference when comparing all participants while none of them showed significant difference when comparing only cognitively impaired participants. *indicates significant difference. The values of columns are MMSE: All participants (with collision 25, without collision 28), cognitively impaired participants (with collision 24.5, without collision 26). Trail A: all participants (with collision 68.5, without collision 49.4), cognitively impaired participants (with collision 69.6, without collision 55.5). Trail B: all participants: (with collision 250, without collision 135.6), cognitively impaired participants (with collision 251.9, without collision 185.5.)

