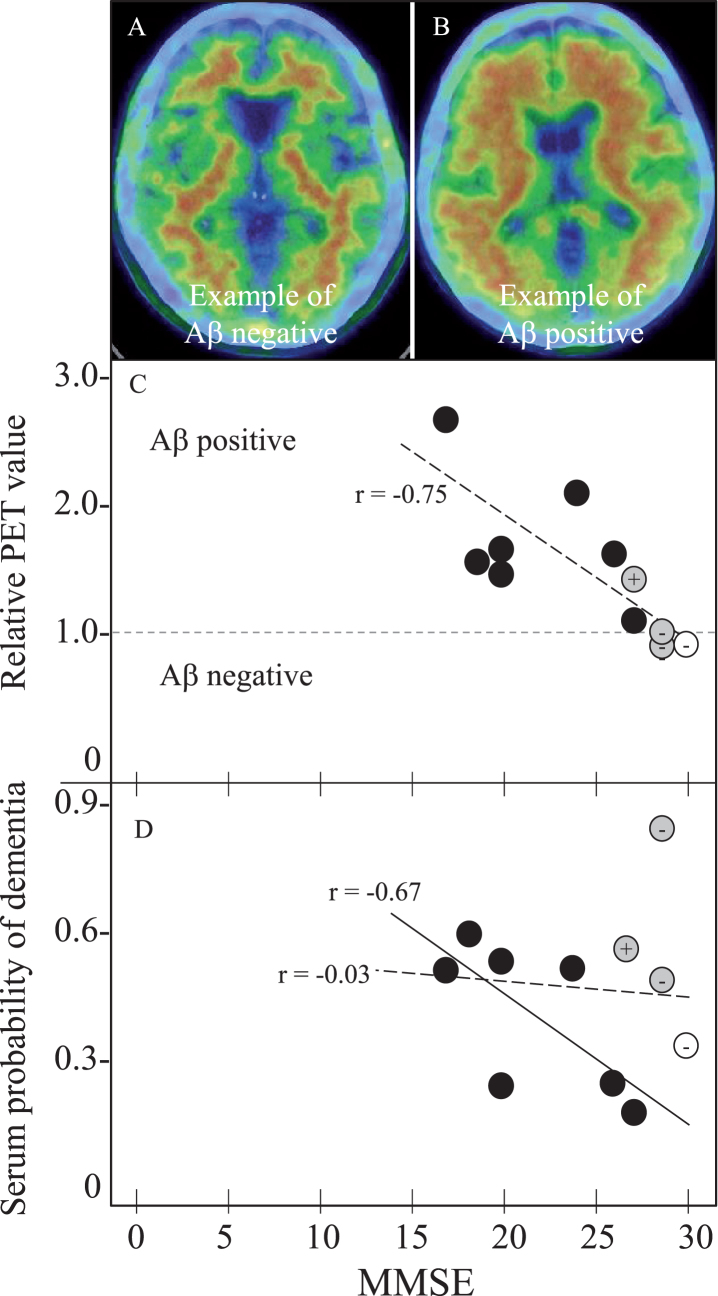
Fig.2.
Amyloid PET and SPD with MMSE in 11 PET subjects for 1 NC, 3 MCI, and 7 AD. Panels A and B shows Aβ negative- and positive-example, (C) MMSE versus relative PET value of negative with 1 or less and positive with more than 1, and (D) MMSE versus SPD. Note the cortical Aβ deposit in PET-positive example (B), the strong correlation of relative PET value with MMSE in all 11 subjects (r = –0.75, p = 0.0070, panel C, oblique dotted line), and a significant correlation of SPD with MMSE in 7 AD patients (r = –0.67, p = 0.0908, panel D, oblique dotted line). Correlation coefficient of SPD versus MMSE was r = –0.03, p = 0.9198 for all 11 subjects (D, dotted line). Open circle represents NC, grey MCI, and black AD. + or – of grey MCI and control are Aβ-PET positive or negative, respectively.

