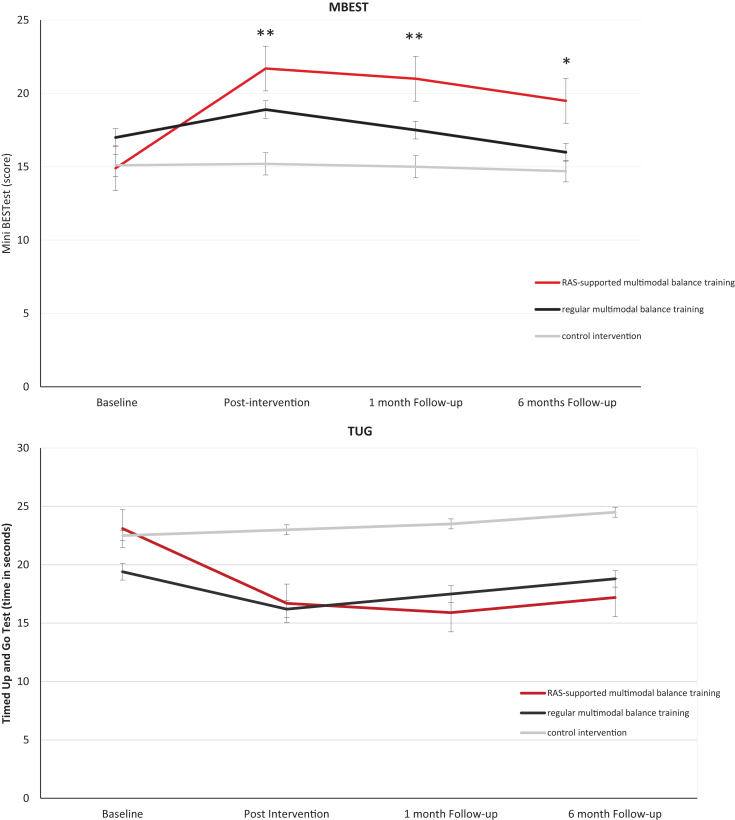
Fig.2.
(A) Mini-BESTest (MBEST) at each test visit. The red line represents RAS-supported multimodal balance training, the black line represents regular multimodal balance training and the gray line represents the control intervention group. Error bars represent the 95% confidence intervals. **all groups are significantly different, *except regular multimodal balance training vs control. (B) TUG (Timed Up and Go Test) at each test visit. The red line represents RAS-supported multimodal balance training, the black line represents regular multimodal balance training and the gray line represents the control intervention group. Error bars represent the 95% confidence intervals.

