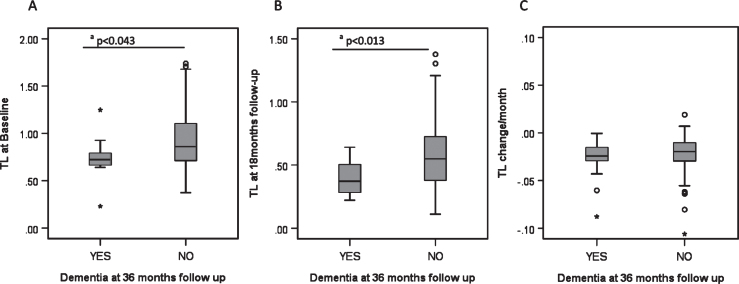
Fig.2.
Biomarkers and development of dementia in PD. A) Telomere length at baseline and its relationship to PD dementia at 36 months. B) Telomere length at 18 month follow-up and its relationship to PD dementia at 36 months. C) Telomere length shortening per month and its relationship to PD dementia at 36 months. Each category box plot includes the median (—), the range of data within the first and third quartiles (box), the range of data within the first and ninth deciles (whiskers) and the outliers falling outside the latter (° = Outlier, * = Extreme Outlier). aStatistically significant using the Mann-Whitney U Test.

