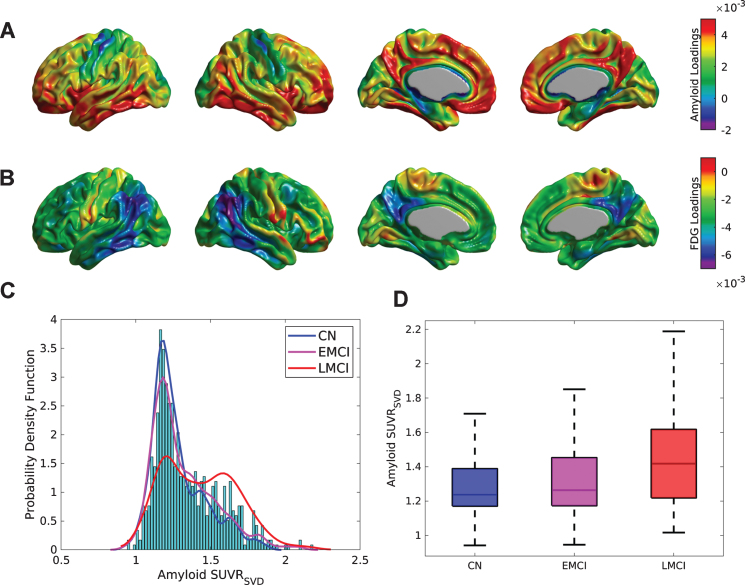
Fig.1.
SVD analysis for the cross-correlation between Aβ and metabolism across the whole sample of florbetapir and FDG PET images. Cortical surface projections for the pair of spatial loadings of (A) Aβ and (B) glucose metabolism corresponding to the first principal component, which accounted for 27.84% of the total co-variability. The strongest positive weights in (A) are regions maximally related to the reduction of glucose metabolism observed in (B), namely, in the angular and inferior temporal gyri. C) Histograms and empirical density distribution of the SVD-based Aβ scores for each clinical sub-population. The CN and EMCI scores show unimodal distributions with maximum peaks around SUVR = 1.2. The LCMI scores show a bi-modal distribution with two peaks around SUVR = 1.2 and SUVR = 1.6. D) Box-plots of the Aβ subject loadings for each cognitive group. The mean SUVRSVD amyloid increases with the cognitive decline (F = 30.84, p < 0.001).

