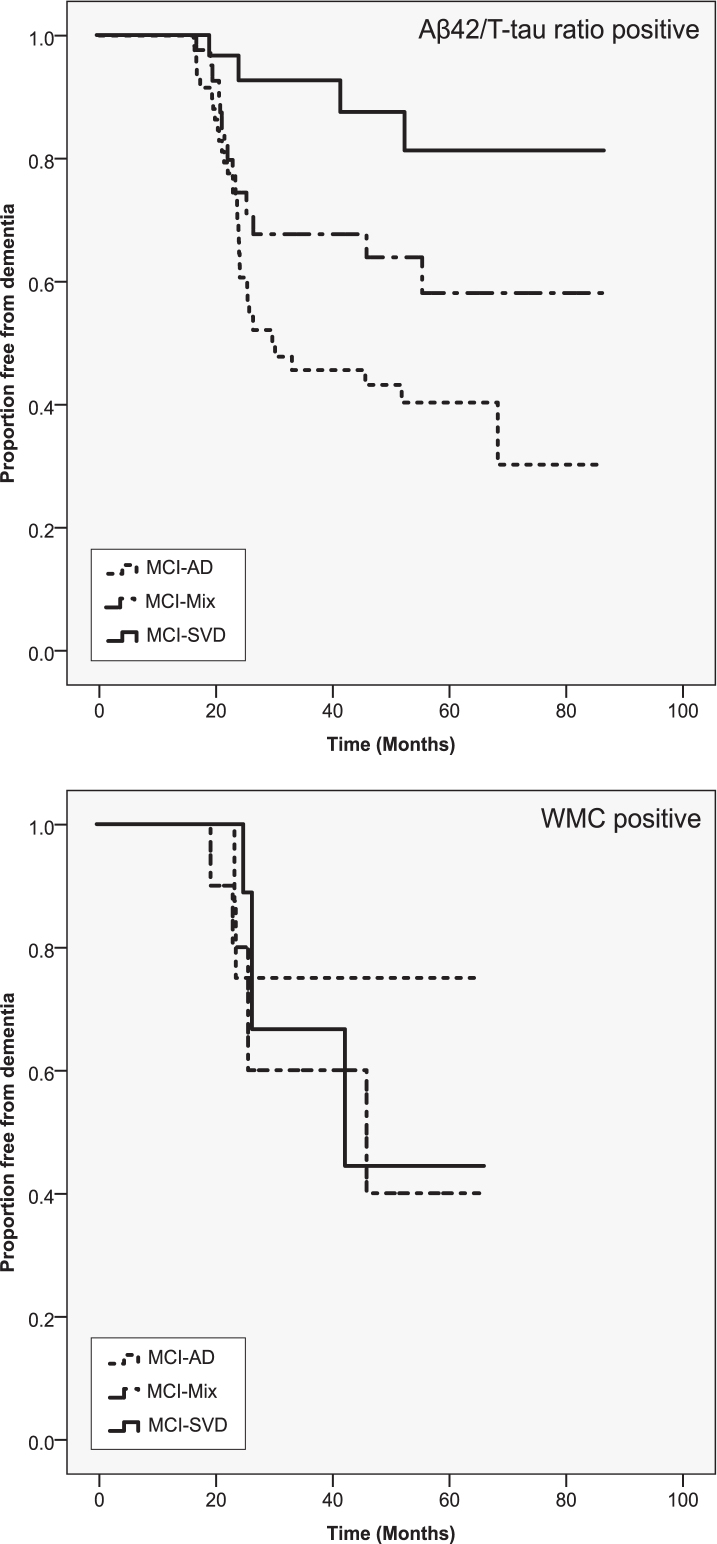
Fig.1.
Survival curves stratified by levels of Aβ42/T-tau ratio and WMC. Only patients with pathological values are displayed. Marker values were designated pathological or non-pathological based on the cut-off scores derived from dementia-control group comparisons. X axis shows proportion of non-demented patients at a given time (months) as shown on the y axis.

