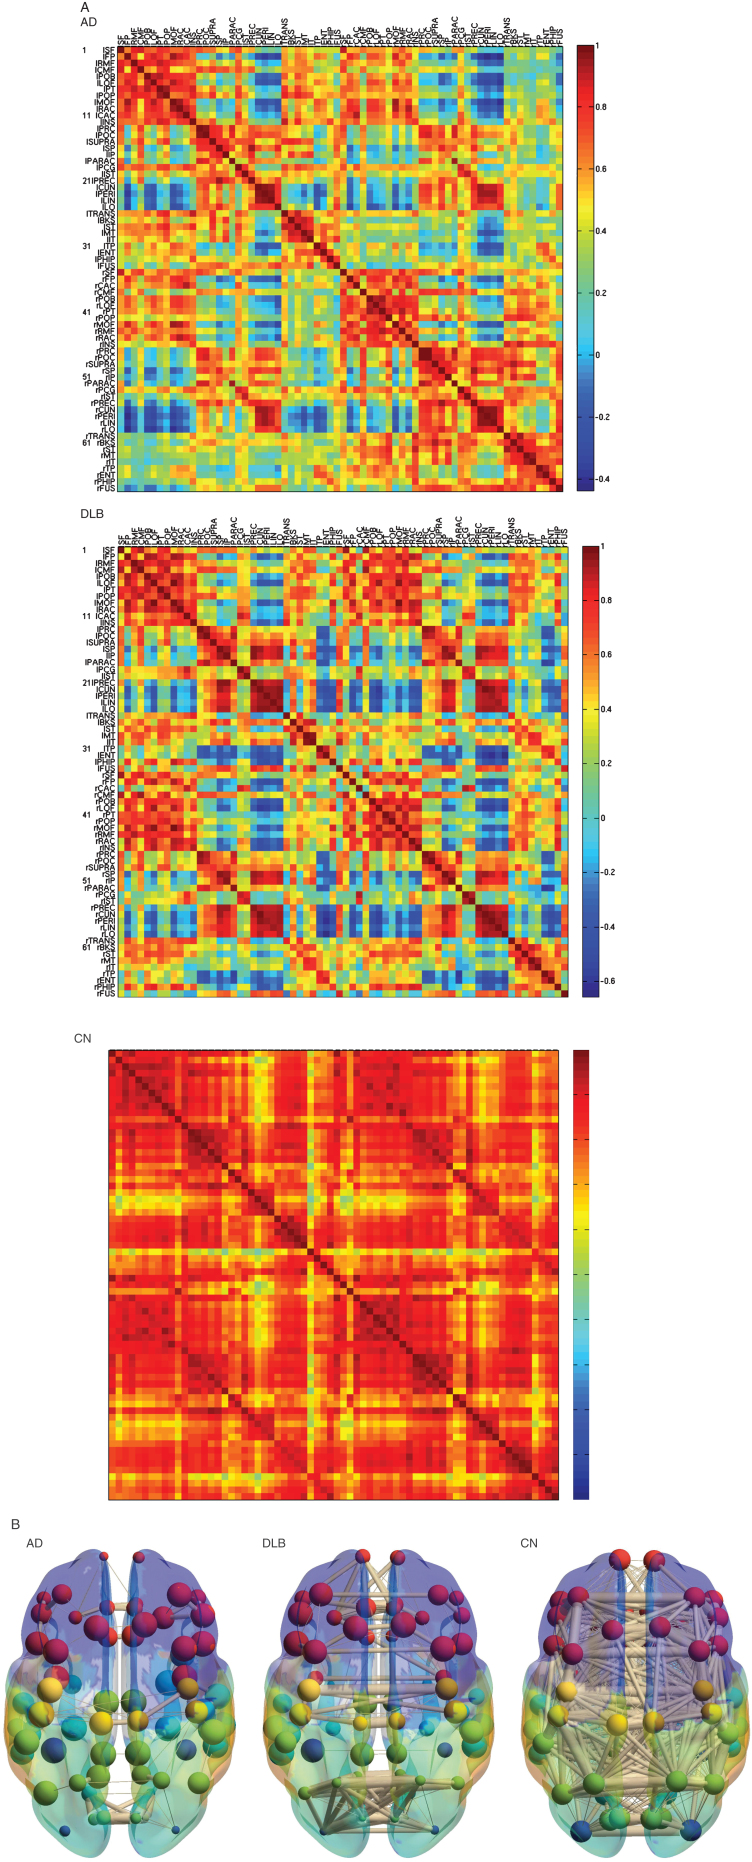
Fig.1.
Metabolic connectivity matrix and anatomical localizations. A) Metabolic connectivity matrix. The cell color in the correlation matrix indicates the magnitude of the correlation, and the color is arranged in gradation from red to blue in accordance with the magnitude of correlation from positive to negative. Note that the lower limit of the correlation range is different in each matrix (See a color navigation side bar). Some of the correlations decreased more severely in DLB than in AD. In addition, other correlations in DLB are relatively preserved. The texture of the matrix in DLB looks “patchy” compared with that in AD. AD, Alzheimer’s disease; DLB, dementia with Lewy bodies; CN, cognitive normal. B) The 3D schematic figures representing metabolic connectivity. The metabolic connections are overlaid on an anatomical atlas using nodes and edges. These figures are used to display an outline of the whole connectivity.

