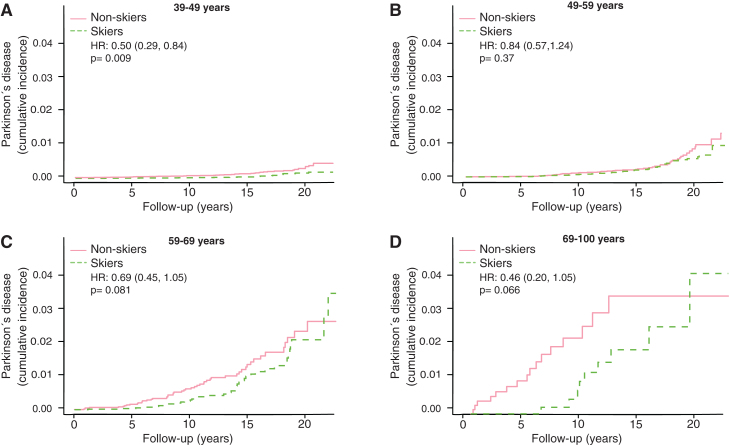
Fig.3.
Kaplan Meier plots of cumulative incidence of Parkinson’s disease in subgroups with different age at participation, 39–49 years (A), 49–59 year (B), 59–69 years (C) and 69–100 years (D). HR represents hazard ratios from an unadjusted cox regression. HR represents hazard ratios from an unadjusted cox regression.

