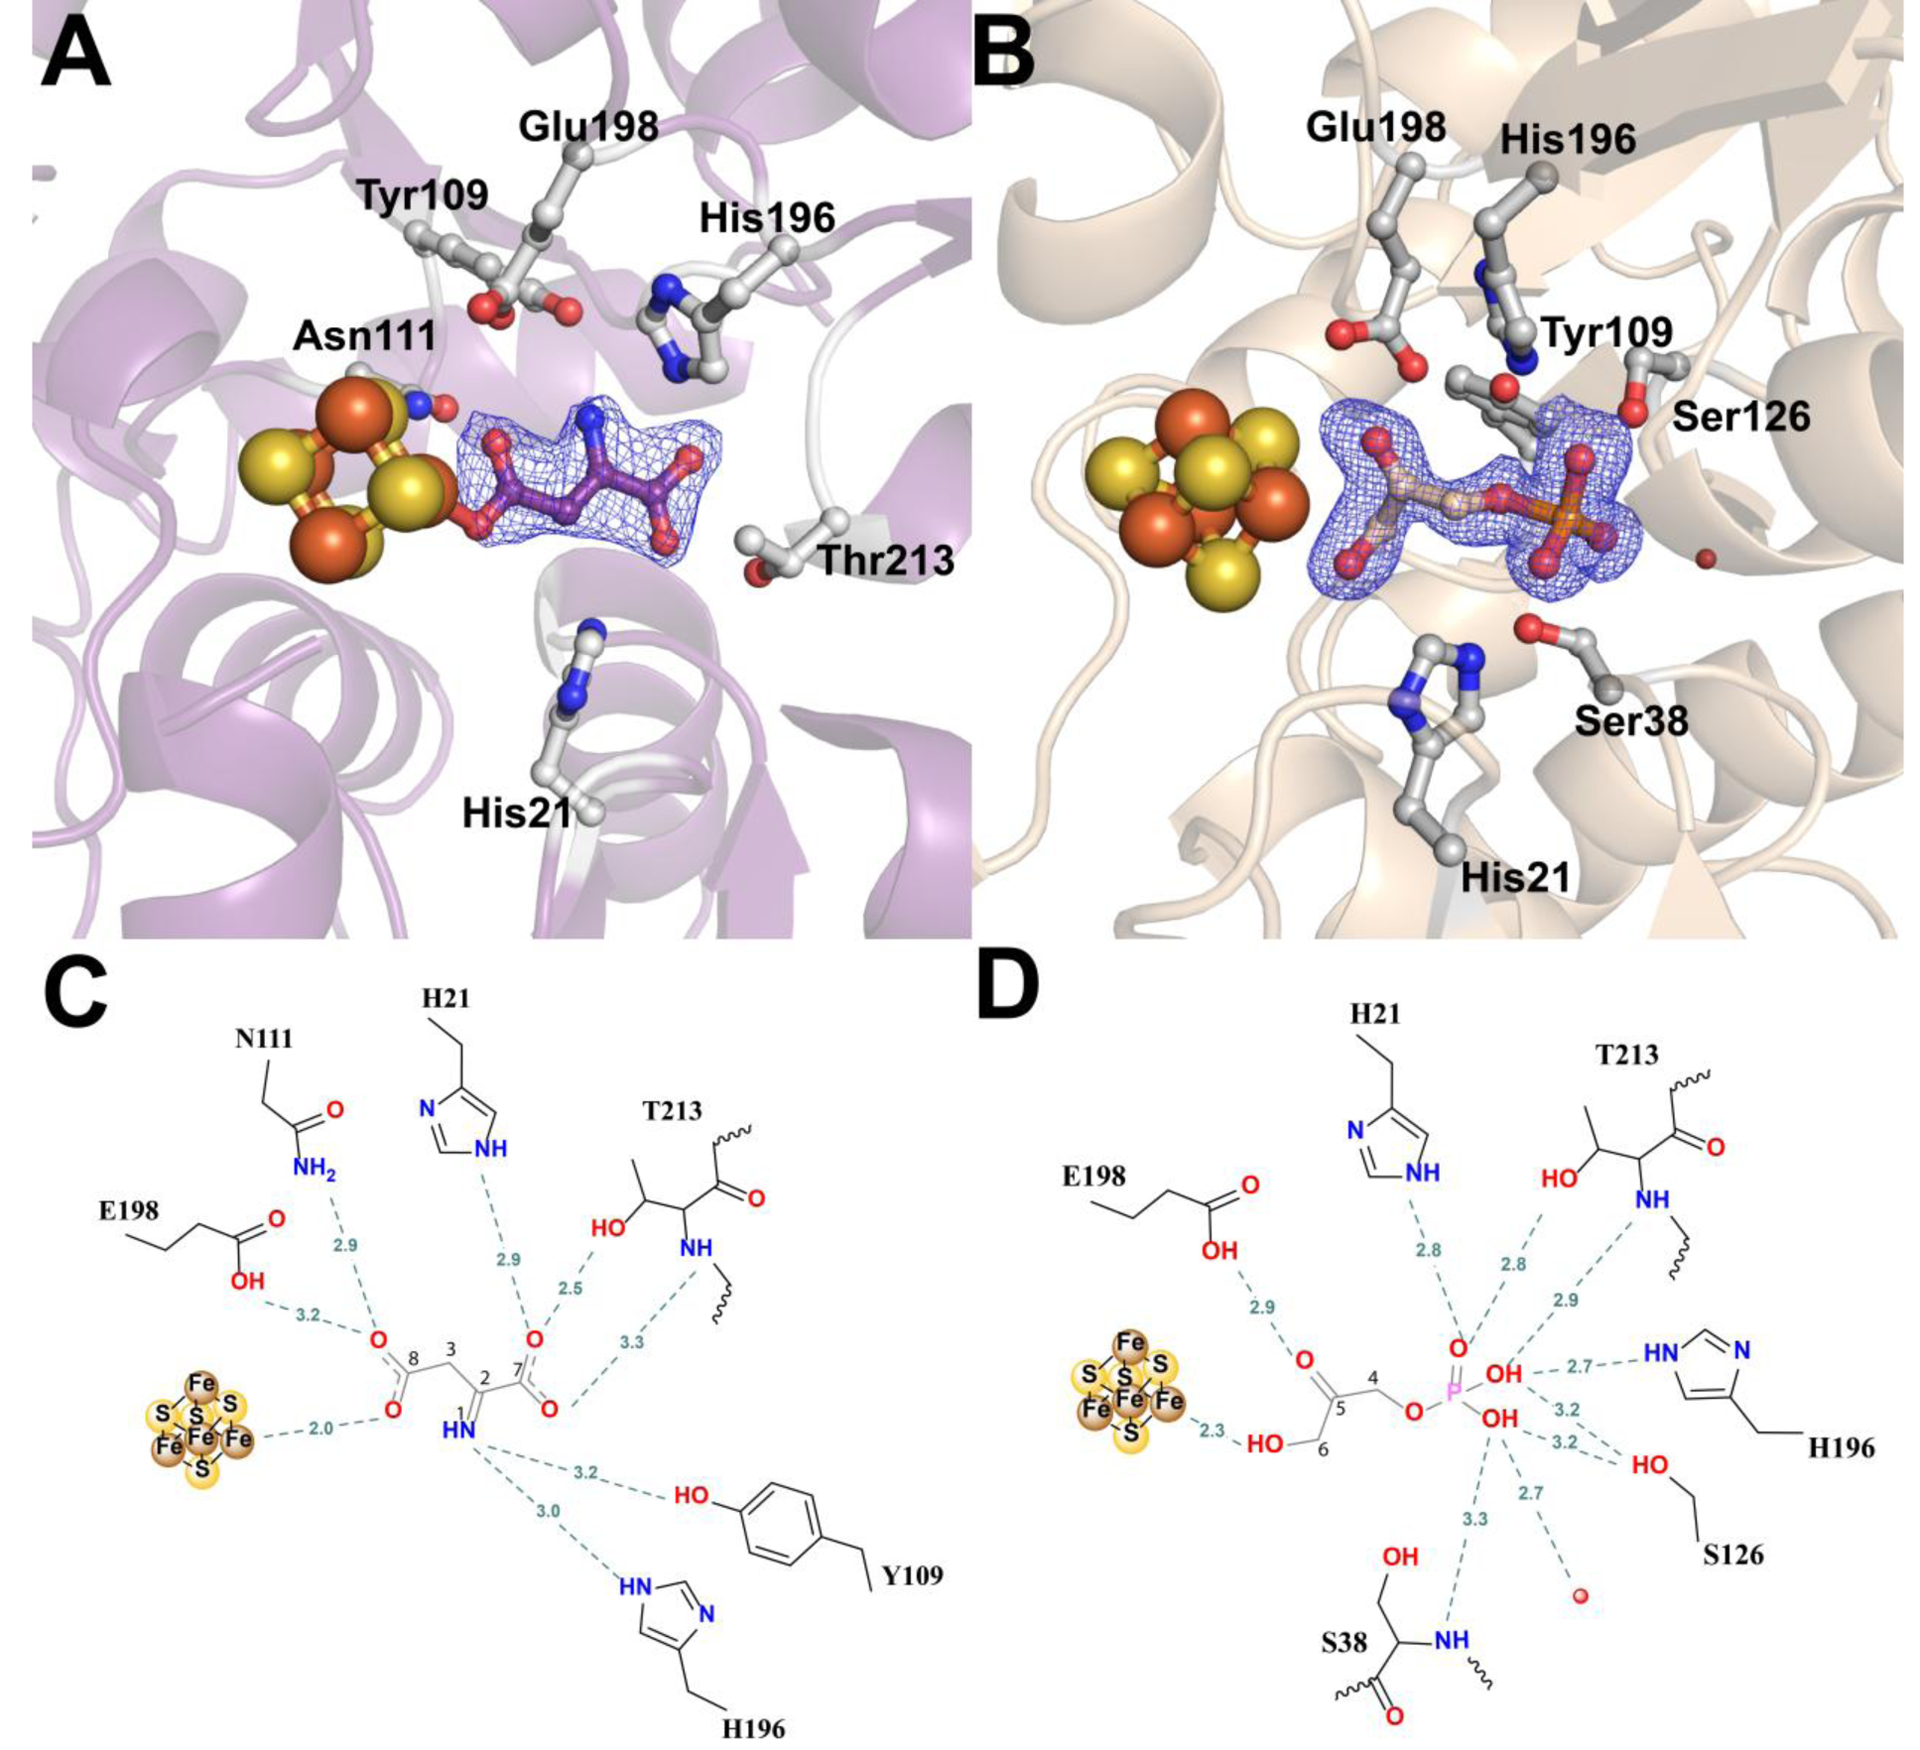
Figure 2.

Active site of PhNadA in complex with: (A, C) IA in the active site of PhNadA, (B, D) DHAP in the active site of PhNadA (A, B) Omit electron density map of substrates in the active site of PhNadA, Fo-Fc electron density is contoured at 2.5σ (blue mesh). (C, D) Schematic diagram of substrates bound in the active site of PhNadA. Atom colors: Fe – orange, S – yellow, N - blue, C – grey and O – red.
