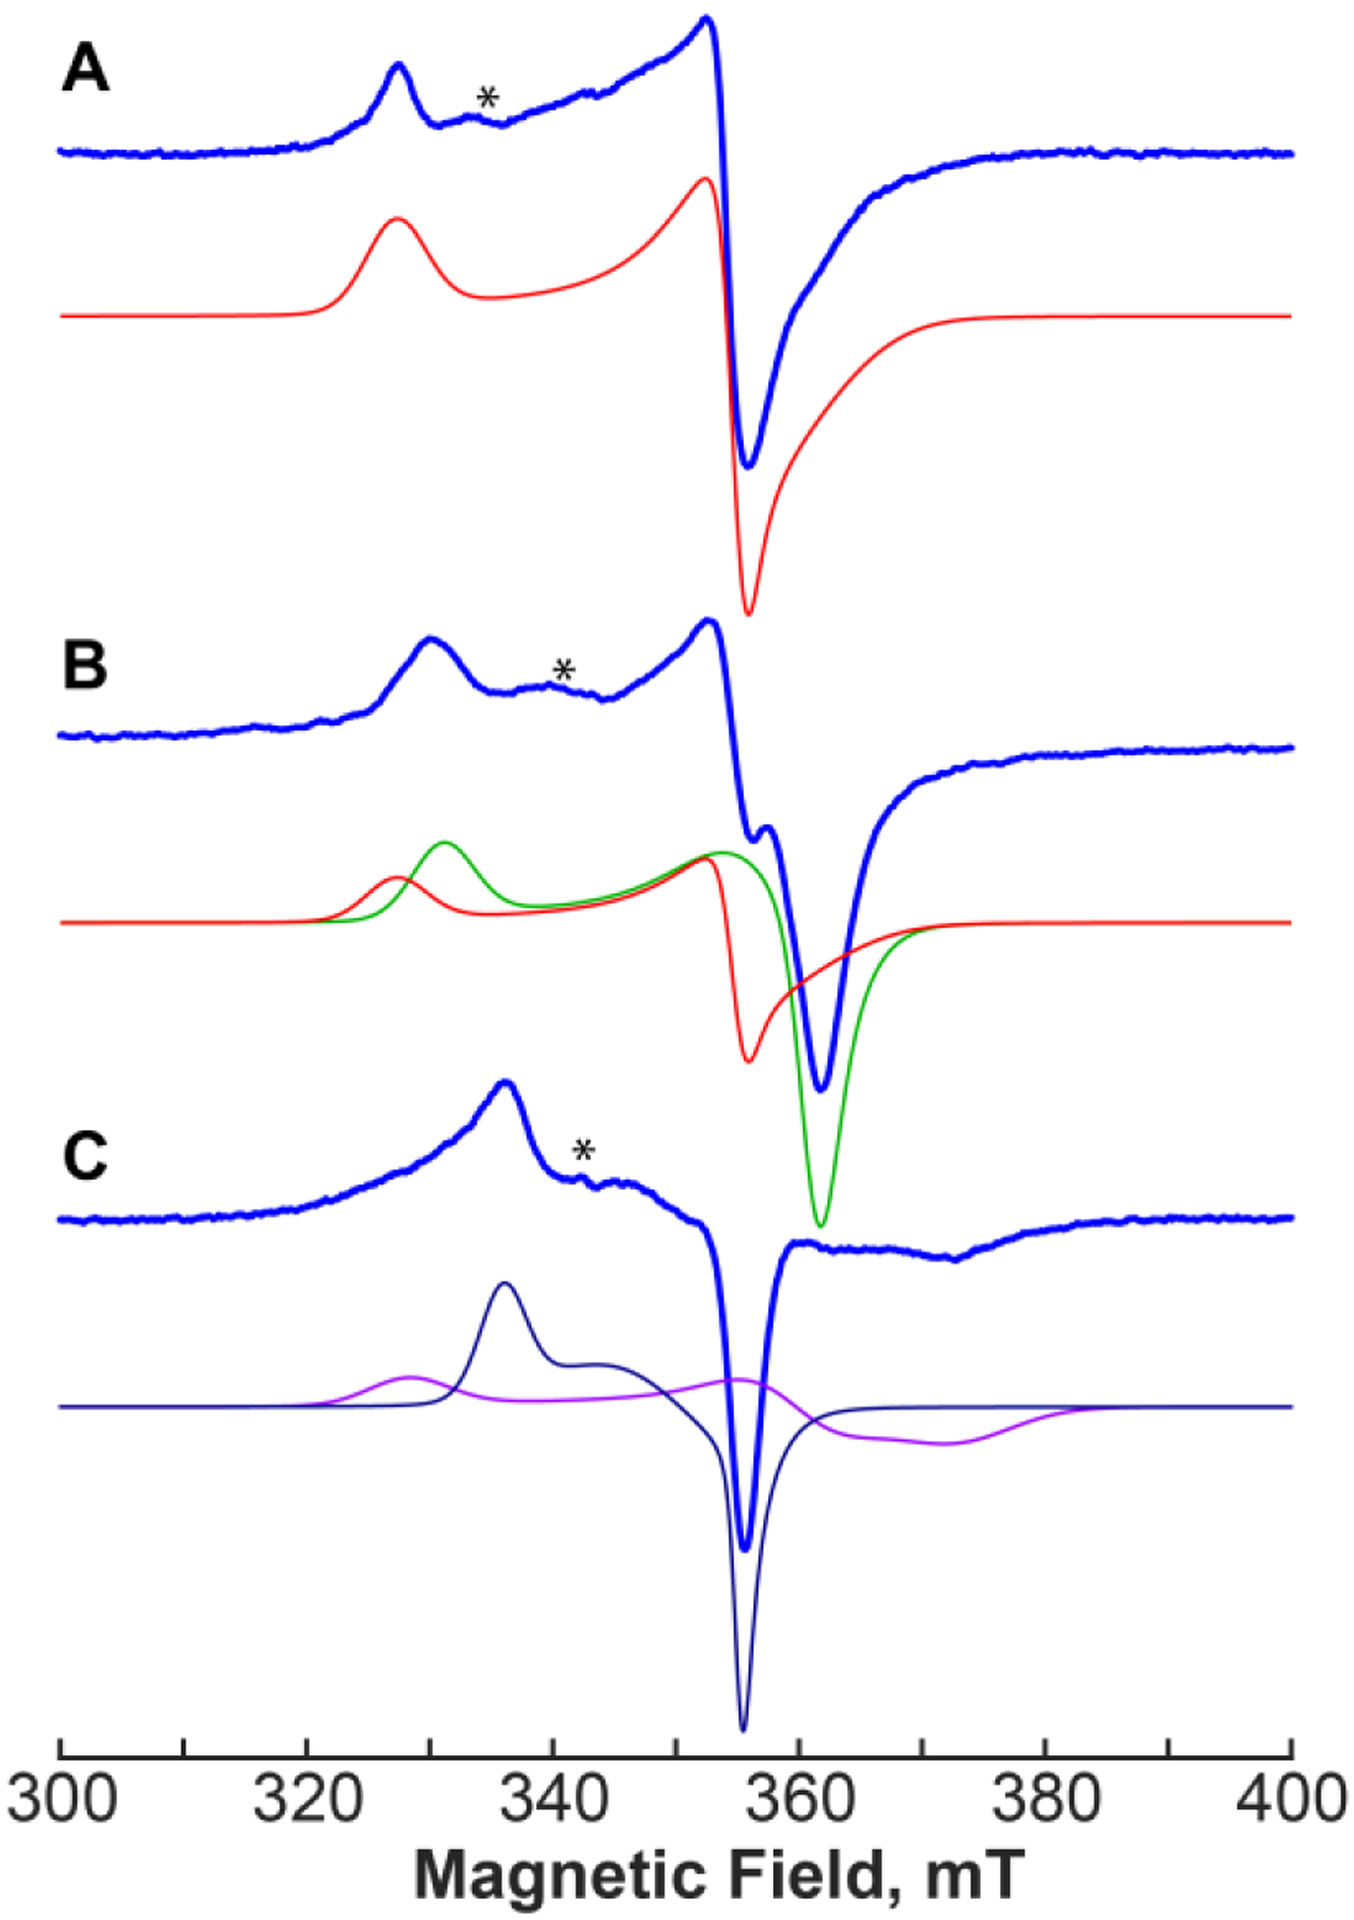
Figure 3.

X-band CW EPR spectra (blue) of PhNadA as reduced (A), PhNadA in the presence of DHAP (B) and PhNadA in the presence of IA (C) and simulated spectral components with the following principal g-values: red in A and B, g=[2.100, 1.937, 1.913]; green in B, g=[2.076, 1.918, 1.904]; magenta in C, g=[2.094, 1.911, 1.842]; dark blue in C, g=[2.045, 1.966, 1.936]. Experimental conditions: temperature 15 K (A, B) 8 K (C); MW frequency, 9.623 GHz; MW power, 2 mW; modulation amplitude, 10 G. Asterisks indicate spectral artifacts.
