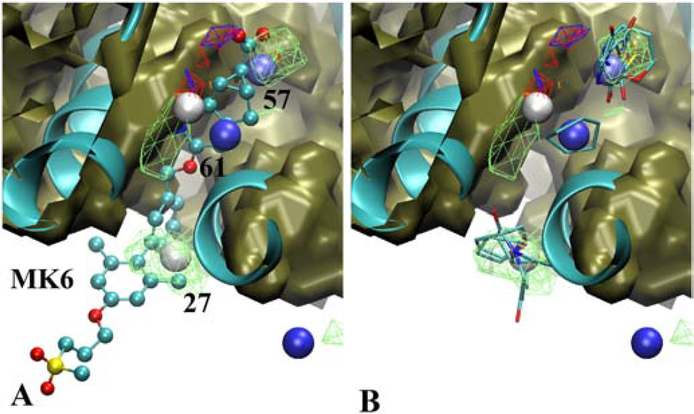
Figure 9).
GPR40 (cartoon, cyan, PDB ID 5KW2) with A) the positive allosteric modulator MK6 (CPK, atom color) or B) selected Fragments for selected Hotspots (labeled and colored by rank). Shown are the SILCS exclusion maps (tan, solid surface), protein backbone (cyan, cartoon representation), selected Hotspots (vdW spheres, coloring based on mean LGFE scores, Table 3), and SILCS FragMaps with cutoff energies for visualization: Positive (cyan, −1.2 kcal/mol), Negative (orange, −1.2 kcal/mol), Apolar (green, −1.2 kcal/mol), H-bond donor (blue, −0.9 kcal/mol) and H-bond acceptor (−0.9 kcal/mol). Fragments shown include 6, 11, 15, 37, and 45 for site 27, 6, 35, 48, 74 and 77 for site 57 and 5 for site 61 (Figure S1 supporting information).

