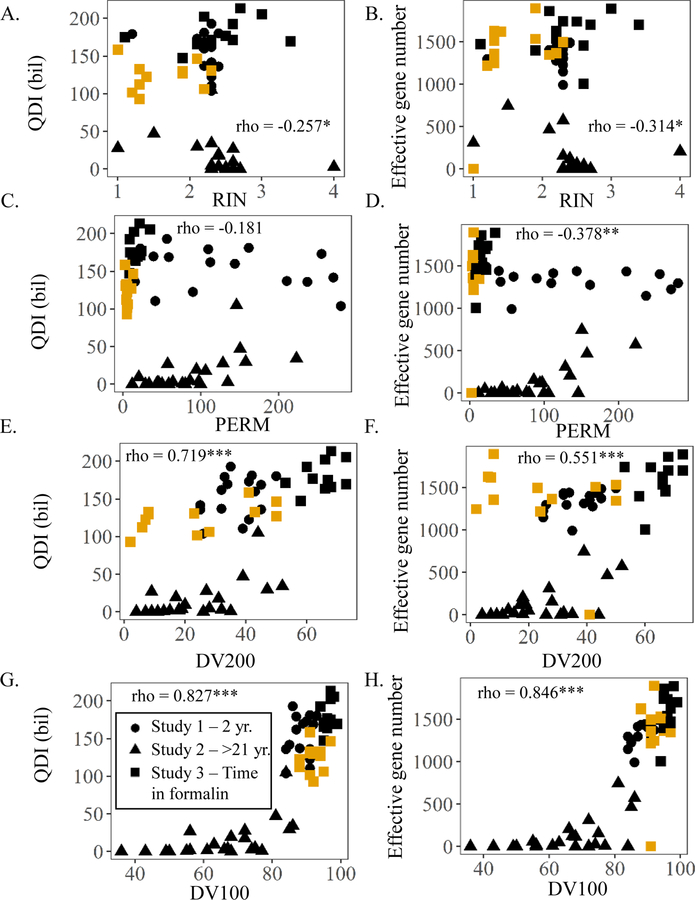
Figure 10.
Correlations between Study 1, 2, and 3 metrics and quantity diversity index (QDI) or effective gene number as an indicator of sequencing success. (A) Correlation between RNA integrity number (RIN) and QDI. (B) Correlation between RNA integrity number (RIN) and effective gene number. (C) Correlation between paraffin embedded RNA metric (PERM) and QDI. (D) Correlation between paraffin embedded RNA metric (PERM) and effective gene number. (E) Correlation between DV200 and QDI. (F) Correlation between DV200 and effective gene number. (G) Correlation between % RNA fragments greater than 100 (DV100) and QDI. (H) Correlation between % RNA fragments greater than 100 (DV100) and effective gene number. rho indicates correlation coefficient for spearman test on only the fixed and embedded samples across all three studies (*, **, and *** indicates p-value <0.05; 0.01; and 0.001 respectively). Symbols filled with BLACK indicates samples fixed for 18 hr. in formalin. Symbols filled with YELLOW indicates samples fixed for 3 mo. in formalin.

