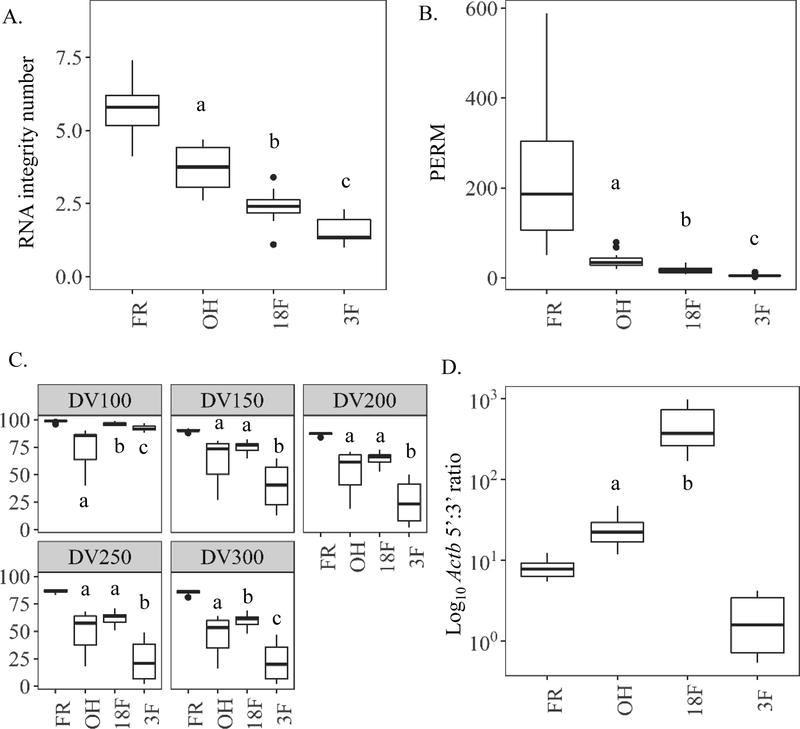
Figure 7.
Study 3 on the effects of time in formalin on RNA quality within paired mouse liver samples preserved in 70% ethanol (OH), 18 hr. formalin then 10% formalin to 3 months (18F), or 3 months in 10% formalin (3F) prior to paraffin-embedding relative to frozen (FR) controls. (A) RNA integrity number (RIN) to quantify RNA quality by Bioanalyzer. (B) Paraffin embedded RNA metric (PERM) to quantify RNA quality using a weighted area under the curve via Bioanalyzer spectropherogram output. (C) Fragment analysis (DV) to quantify the percent of RNA fragments greater than a specified value (100, 150, 200, 250, or 300 nucleotides) by Bioanalyzer smear test. (D) Ratio of similarly sized 5’ most Actb amplicon to 3’ most amplicon copies (5’-Actb/3’-Actb) as measured by digital drop PCR. Values of less than 10 indicate more intact, higher quality RNA. a, b, and c indicate p value <0.05, paired, pairwise Wilcoxon signed rank test.

