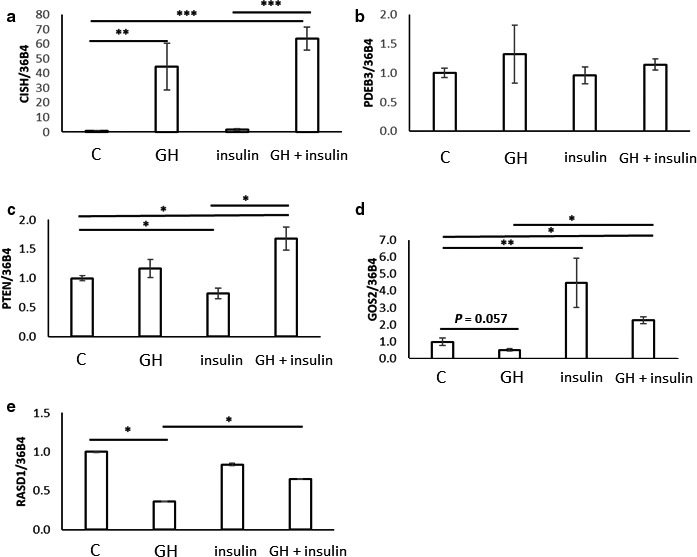
Figure 5.

qPCR analysis of CISH, PDE3B, PTEN, G0S2, and RASD1 mRNA abundance isolated from 3T3‐L1 adipocytes with no treatment (C), treated with 500 µg/l bGH (GH) and/or 100 nmol/l insulin for 2 hr. Data are shown as mean ± SE of three independent experiments. *p; .05, **p; .01, ***p; .001
