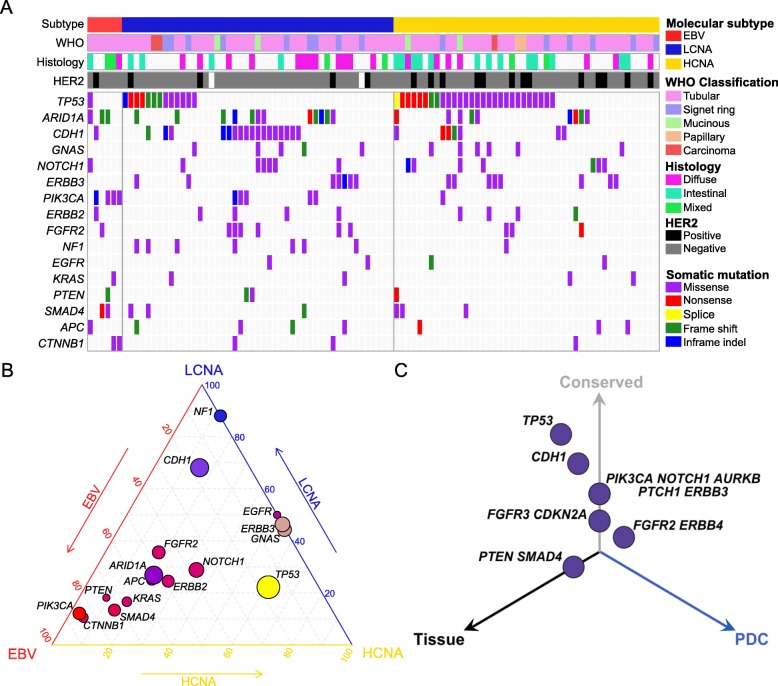
Fig. 1.
Mutational landscape of gastric cancer. a Mutational landscape of gastric cancers based on molecular subclassification; EBV-positive, LCNA, and HCNA tumors. All mutations with variant allele frequency of > 5% and depth of > 20 reads are shown. b Ternary diagram depicting mutation frequencies in EBV-positive, LCNA, and HCNA tumors. The size of each node represents the number of tumors with the respective mutation, and the color spectrum indicates its relative frequency. c Three-dimensional bubble plot showing the frequency of non-synonymous cancer-driver genomic mutations exclusively in tissue (black, left axis), in PDCs (blue, right axis), or in both (gray, upper axis). The position of each dot or mutation is located on the quadrant based on its shared or private rate between primary tumor tissues and matched PDCs, and the distance reflects the number of cases that harbor respective mutation

