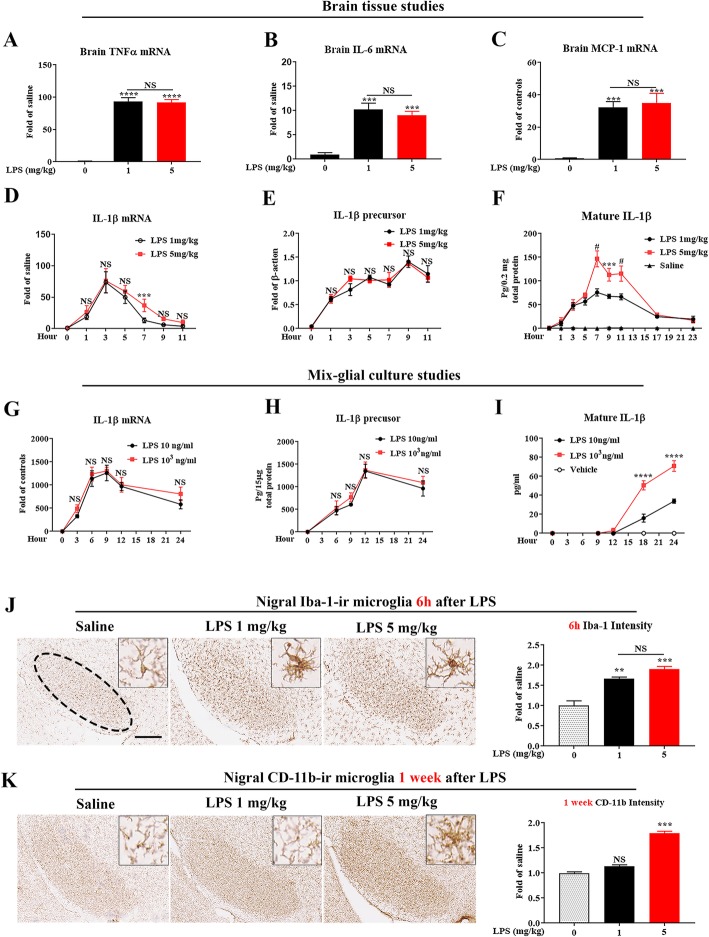
Fig. 1.
Peripheral LPS dose-dependently increases brain mature IL-1β production and causes sustained nigral microglial activation. In vivo cytokine measurements (a–f): At 1 h after injection of LPS (1 or 5 mg/kg, ip) or saline vehicle in C57BL/6 J mice, mRNA levels of TNFα (a), IL-6 (b), and MCP-1 (c) were detected by qPCR in brain tissues (n = 4/group). ***p < 0.001 and ****p < 0.001 compared with saline vehicle group. No significant difference (NS) between LPS 1 and 5 mg/kg groups. One-way ANOVA followed by Bonferroni post hoc multiple comparison test. Levels of IL-1β mRNA (d), and its precursor (d) and mature IL-1β (F) were measured in brain tissues at indicated time points by qPCR, Western blot quantification, and ELISA, respectively (n = 3–5/group for each timepoint). ***p < 0.001, #p < 0.0001, or NS compared with LPS 1 mg/kg group. Two-way ANOVA followed by Bonferroni post hoc multiple comparison test. In vitro IL-1β measurements (g–i): In C57BL/6 J mix-glia cultures after LPS (10 ng/ml or 103 ng/ml), or vehicle medium treatment, mRNA (g), supernatant precursor (h), and mature form (i) of IL-1β were determined at indicated time points by qPCR or ELISA, respectively. Results were from three independent experiments. ****p < 0.001 compared with LPS 10 ng/ml group. Two-way ANOVA followed by Bonferroni post hoc multiple comparison test. In vivo microglial activation (j, k): At 6 h and 1 week after injection of LPS (1 or 5 mg/kg, ip) or saline vehicle in C57BL/6 J mice (n = 3/group for each timepoint), nigral microglial Iba-1 (j) or CD-11b (k) immunostaining was performed, respectively. Representative images were shown. Scale bar = 300 μm. The histograms showed the density of Iba-1 (j) or CD-11b (k) quantified by with ImageJ. **p < 0.01 and ***p < 0.001 compared with saline vehicle group, and NS between LPS 1 and 5 mg/kg groups. One-way ANOVA followed by Bonferroni post hoc multiple comparison test

