Fig. 7.
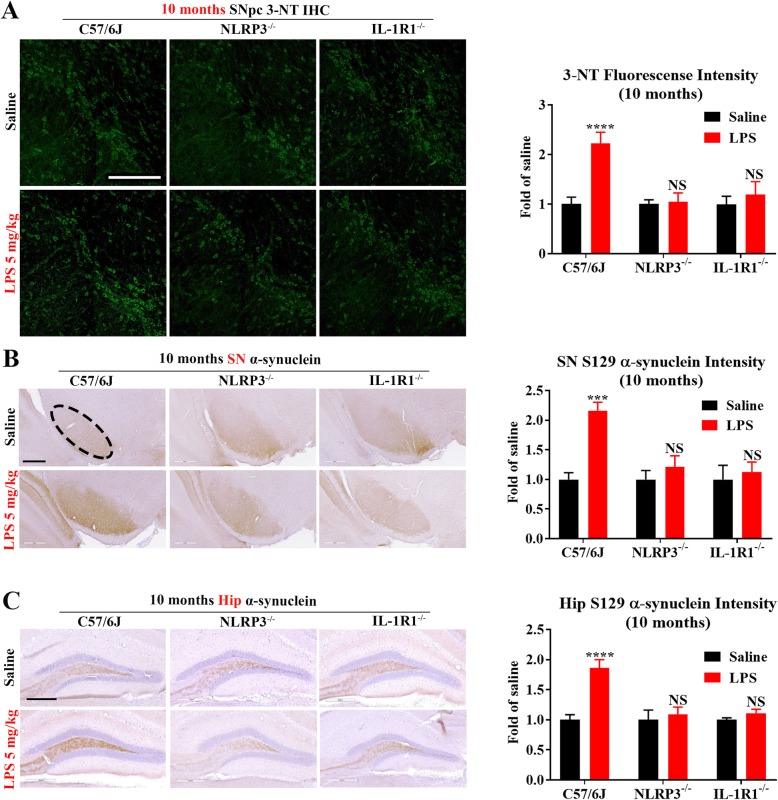
Peripheral LPS injection yields less protein nitrosylation and α-synuclein phosphorylation in NLRP3−/− or IL-1R1−/− mice. At 10 months after LPS (5 mg/kg, ip) or saline injection, representative images of 3NT immunofluorescence (green) in SN and the intensity of 3NT quantified with ImageJ were shown (a). N = 3/group. Bar = 300 μm. Representative images of Ser-129 phosphorylated α-synuclein staining in SN (b) and hippocampus (Hip) (c) and the intensity of Ser-129 phosphorylated α-synuclein staining (brownish staining in the mossy fibers) quantified with ImageJ were shown (S129 in the pictures means Ser-129 phosphorylated). N = 3/group. Scale bar = 400 μm (SN) or 300 μm (Hip). ***p < 0.001, ****p < 0.001, and NS compared with respective saline group. Two-way ANOVA followed by Bonferroni post hoc multiple comparison test

