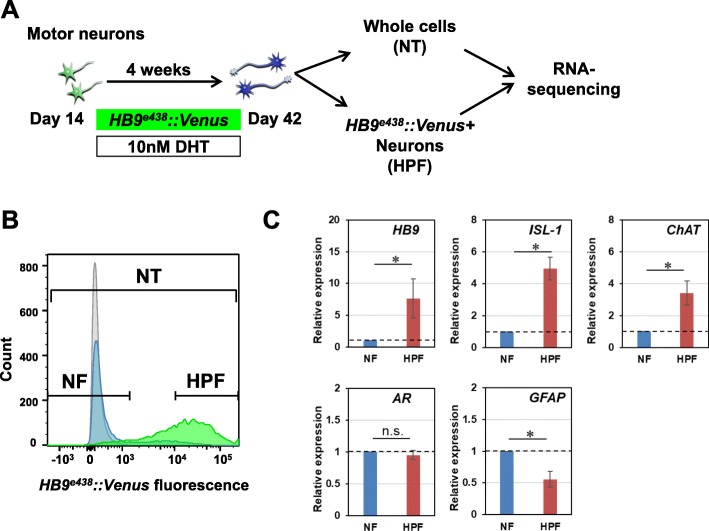
Fig. 4.
Purification of HB9e438::Venus positive MNs by flow cytometry. a Schematic presentation of the culture protocol for flow cytometry and cell sorting. b Schematic histogram for determining a negative fraction (NF) and high-positive fraction (HPF). NF consists of uninfected cells (gray). HPF consists of top 2/3 fraction of HB9e438::Venus+ cells (green). NT consists of unpurified cells. Blue, background lentiviral infected cells. c Quantitative RT-PCR analysis of HB9, ISL-1, ChAT, AR, and GFAP expressions at 4 weeks. Data are normalized to β-ACTIN and presented as the relative expressions to controls (n = 4, means ± SEM). Significant increases in the expressions of HB9, ISL-1, and ChAT are observed in the HPF. A significant decrease in the expression of GFAP is observed in the HPF (*p < 0.05; Student’s t-test)

