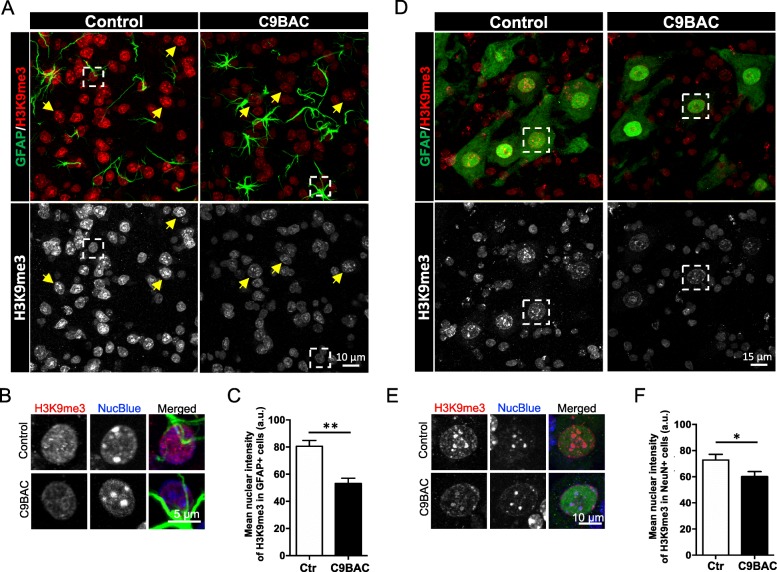
Fig. 3.
Reduced H3K9me3 staining at chromocenters in spinal cord glial cells and motoneurons from C9BAC mice. a Representative confocal images of immunofluorescence staining for H3K9me3 (red and white) and for the activated astrocyte marker GFAP (green) in lumbar spinal cord slices (40 μm) of control and C9BAC mice. The images represent a maximum projection for the total nuclear volume. Arrows mark GFAP-negative cells. Boxes mark selected GFAP-positive cells. b GFAP-positive cells selected from the boxed areas in a depicted at higher magnifications, showing individual and merged images of H3K9me3 (white and red), NucBlue (white and blue), and GFAP (green). c Quantification of the mean nuclear intensity of H3K9me3 staining (a.u.) in GFAP-positive cells. d Representative confocal images of immunofluorescence staining for H3K9me3 (red and white) and for the neuronal nuclei marker NeuN (green) in lumbar spinal cord slices (40 μm) of control and C9BAC mice. The images represent a maximum projection for the total nuclear volume. Boxes mark selected NeuN-positive cells. e NeuN-positive cells selected from the boxed areas in d depicted at higher magnifications, showing individual and merged images of H3K9me3 (white and red), NucBlue (white and blue), and NeuN (green). f Quantification of the mean nuclear intensity of H3K9me3 staining (a.u.) in NeuN-positive cells. In all graphs, bars represent mean ± SEM. *P< 0.05, **P< 0.01, unpaired Student’s t test (n = 3 mice, at least 20 NeuN-positive and 20 NeuN-negative cells were analyzed per animal)

