Fig. 5.
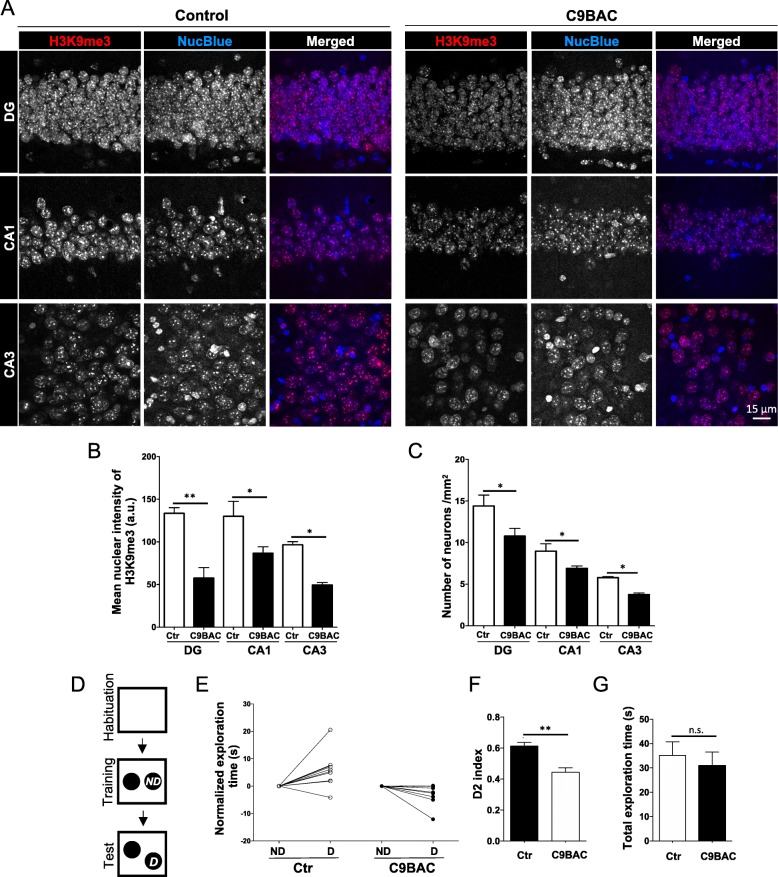
C9BAC mice show reduced intensity of H3K9me3 staining at chromocenters, hippocampal neurons, and deficits in OLM. a Representative immunostaining of H3K9me3 in the dentate gyrus (DG), CA1, and CA3 hippocampal regions of control and C9BAC mice (coronal brain section 40 μm). Images show maximum projection. b Quantification of mean nuclear intensity of H3K9me3 staining (a.u.) per nucleus (n = 3). c The density of neuronal nuclei in every region of the hippocampus was quantified (n = 4). In the graphs, bars represent mean ± SEM. *P< 0.05, **P< 0.01, one-way ANOVA (at least 30 nuclei were analyzed per animal). d Overview of the OLM task, in which mice are subjected to habituation, followed by exposure to two similar objects (“Training”), then tested 24 h later (“Test”) by re-exposure for 10 min to the same testing area with one non-displaced object (ND) and one displaced object (D). e Graph shows normalized exploration time (in seconds) spent by individual control (Ctr) and C9BAC mice on non-displaced (ND) versus displaced (D) object. f Discrimination index (D2) corresponding to the time spent in exploring the displaced (D) object over the total time exploring both objects: an index of 0.5 indicates that mice did not discriminate between the D and ND object. g Total exploration time. Bars represent means ± SEM. **P< 0.01, unpaired Student’s t test (n = 7 mice)

