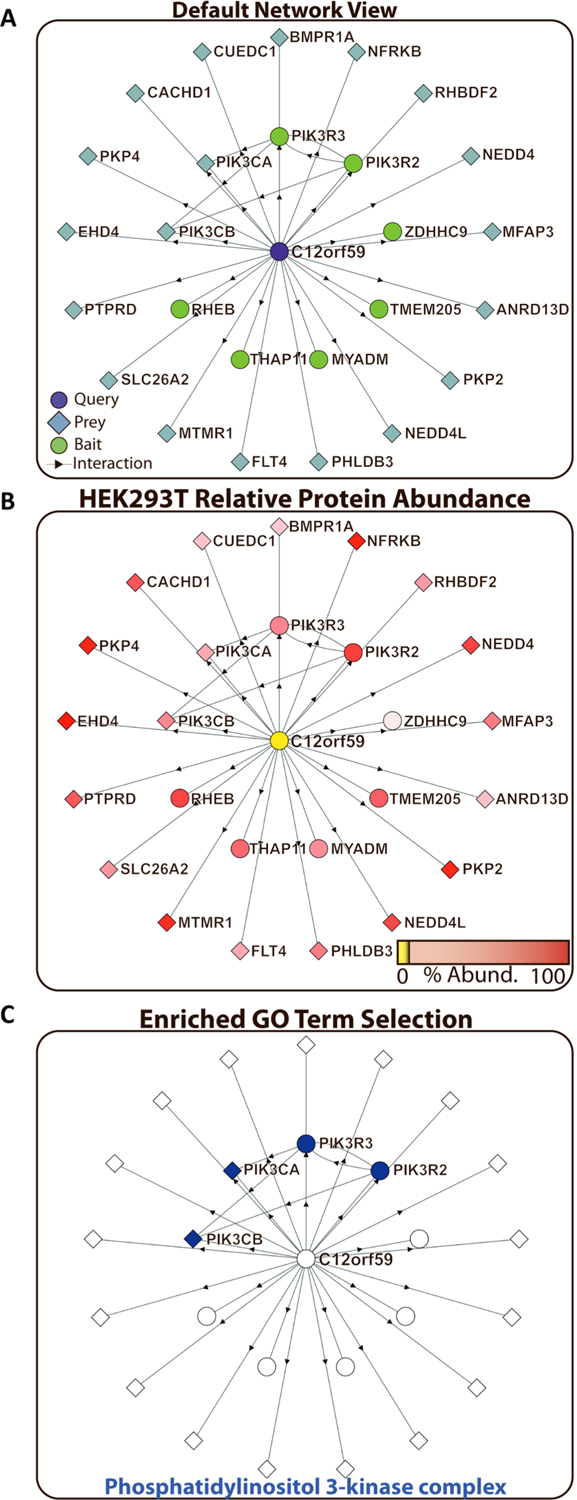
Figure 2.

Network exploration and hypothesis development for the uncharacterized protein C12orf59. (A) Default representation of a queried protein interaction subnetwork. Proteins used as baits at some point in the BioPlex project are shown as green circles. Proteins only identified as preys are shown as blue diamonds. The original protein query is highlighted in purple, and its annotation as either a BioPlex bait (circle) or a prey-only protein (diamond) is retained. (B) On the basis of previous spectral-counting data for HEK293T cells, the relative protein abundance for each protein in the C12orf59 network is shown as a gradient from high expression (red) down to no detection (yellow). (C) For each protein interaction network, gene ontology (GO) annotation enrichment is calculated. Proteins belonging to specific GO annotation groups can be highlighted. Phosphatidylinositol 3-kinase complex proteins (orange nodes) were observed to be enriched in the C12orf59 interaction network (Fisher’s Exact test adjusted p-value: 2.30 × 10⁻⁸).
