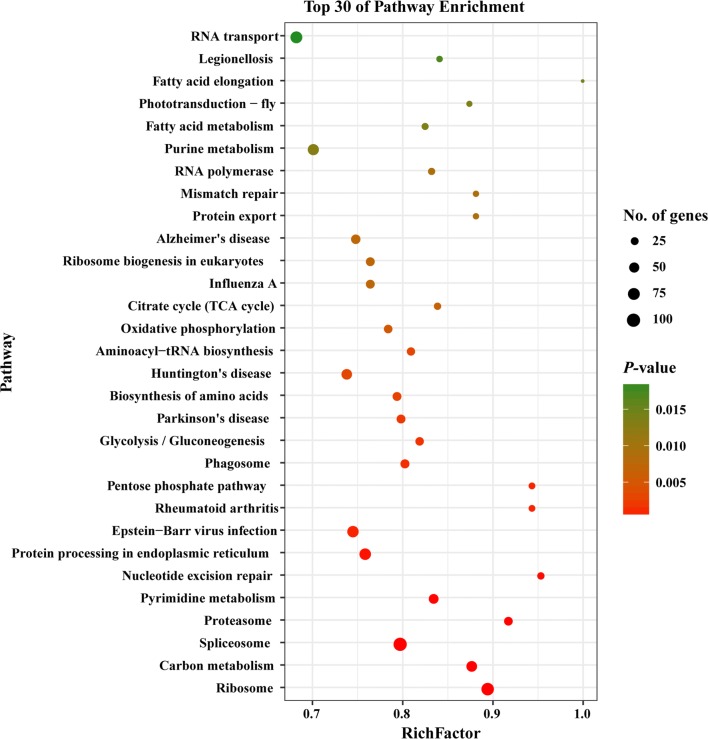
Fig. 6.
Scatterplot of the top 30 most enriched KEGG pathways of T. gondii. Y-axis label represents the distinct KEGG pathways, and X-axis label represents the Rich Factor. Rich Factor refers to the ratio of DEGs annotated in the pathway to total number of genes annotated in the pathway. The greater the Rich Factor, the greater the degree of pathway enrichment. Dot size represents the number of DEGs (bigger dots denote large DEG number and vice versa). The colours of the dots represent the P-values of enrichment. Red colour indicates high enrichment, while green colour indicates low enrichment

