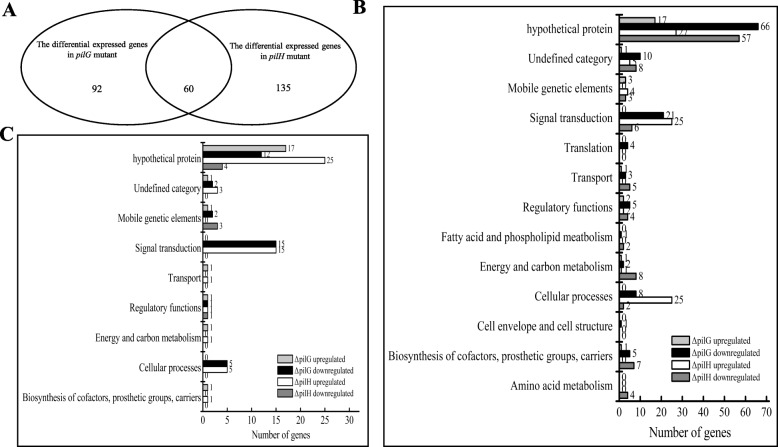
Fig. 3.
Functional categories of the differential expressed genes in two mutant backgrounds. a The venn diagram showed the overlap between the differential expressed genes in two mutant backgrounds. b Functional categories of the differential expressed genes in two mutant backgrounds. The differential expressed genes from Additional file 7: Table S2 and Additional file 8: Table S3 were broadly categorized according to their biological function. c Functional categories of overlap of the differential expressed genes in two mutant backgrounds. The differential expressed genes from Additional file 9: Table S4 were broadly categorized according to their biological function. Each bar represents the number of differential expressed genes in each category of Xcc 8004 genome

