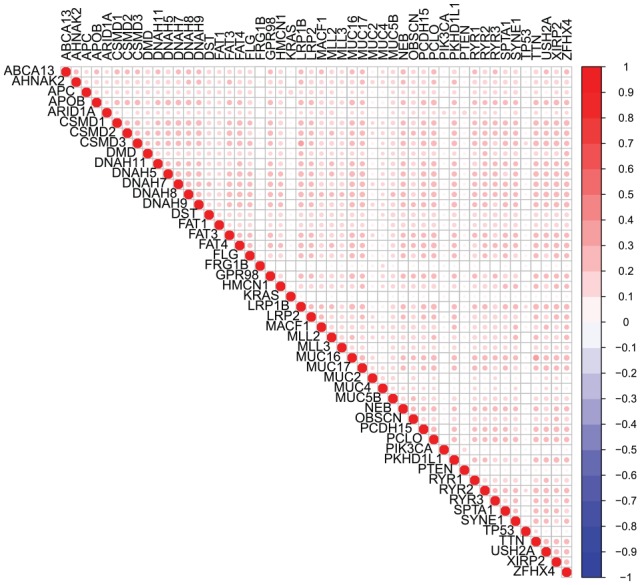
Figure 1.

Correlation plot for correlations between somatic mutation statuses across tissue types. Blank squares indicate nonsignificant correlation between 2 genes. Squares that contain a circle indicate significant correlations and the magnitude of the correlation is indicated by the color opacity.
