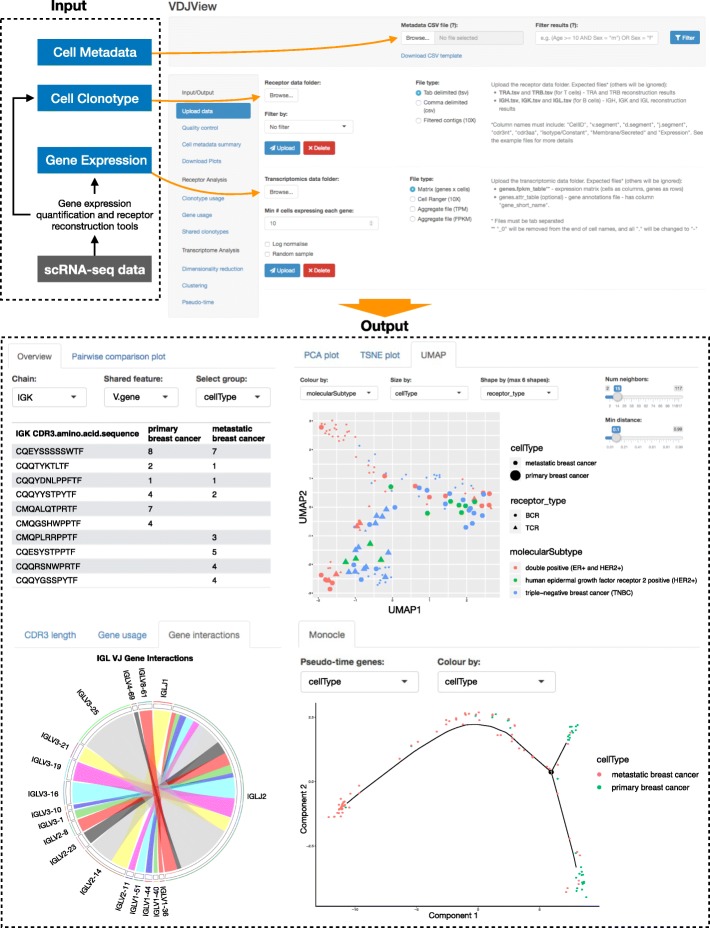
Fig. 1.
Overview of VDJView. Top: VDJView upload page, showing where required (immune receptor sequences and gene expression matrix) and optional inputs (metadata) can be uploaded. Bottom: examples of analysis using scRNA-seq from primary cancer tissues and metastatic lymph-node revealing clonally expanded T and B cells. The table (top left) shows a clonal expansion of IGL chains across primary breast tissue and metastatic lymph-node. The Circos plot (bottom left) shows the IgL V and J gene pairings identified. Dimensionality reduction using UMAP (top right) shows a cluster of B cells derived from metastatic lymph-node in two patients with ER+ HER2+ breast cancer, while T and B cells from the primary breast cancer tissue had similar gene signature regardless of molecular subtype. Pseudo-time plot (bottom right) shows the inferred evolutionary trajectory between all immune cells determined by genes that differentiate primary from metastatic tissues in two subjects with matched samples

