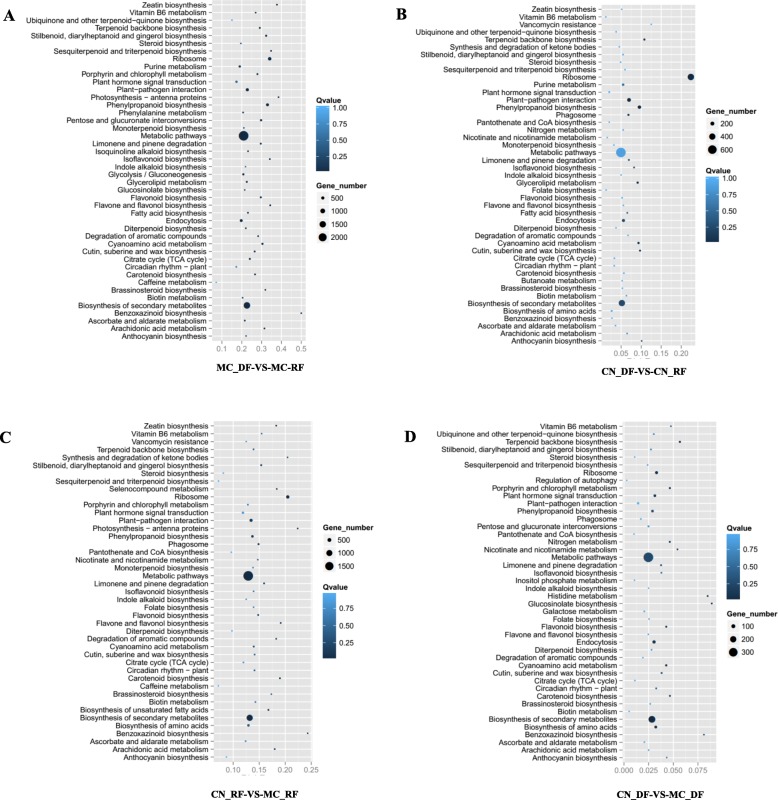
Fig. 3.
Pathway enrichment analysis by tissue pair comparisons. The ratio between the number of DEGs mapped to a pathway and the total number of genes mapped to that pathway are indicated by enrichment factors. a Disk florets of German chamomile vs. Ray florets of German chamomile (MC_DF-VS-MC-RF), b Disk florets of Roman chamomile vs. Ray florets of Roman chamomile (CN_DF-VS-CN_RF), c Ray florets of Roman chamomile vs. Ray florets of German chamomile (CN_RF-VS-MC_RF), d Disk florets of Roman chamomile vs. Disk florets of German chamomile CN_DF-VS-MC_DF. A larger enrichment factor indicates greater intensiveness. X-axis represents KEGG pathways, Y-axis represents enrichment factors. The Q values were calculated using a hypergeometric test with the Bonferroni Correction. The Q value is a corrected p value that ranges from 0 to 1, and lower Q values mean greater intensiveness. “Gene number” refers to the number of DEGs mapped to a given pathway.

