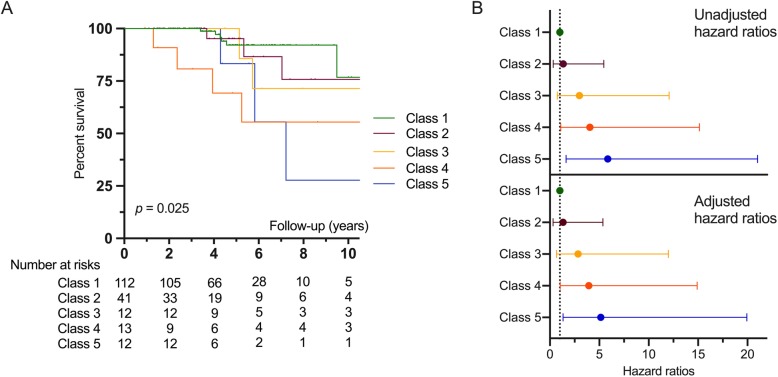
Fig. 4.
Survival of the 5 trajectory classes of the 5-class LCMM. a Kaplan-Meier curves of 5-class LCMM (p = 0.025). Time 0 was defined by the date of the first non-Raynaud’s Phenomenon symptom. b Forest plot showing mortality hazard ratios and 95% confidence intervals for the 5 trajectory classes before (top) or after (bottom) adjusting for sex and age. Broken line shows the hazard ratio for the reference group

