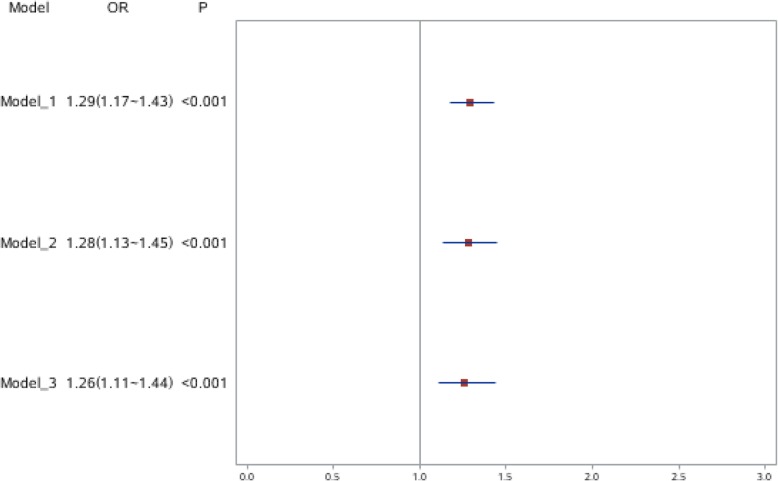
Fig. 1.
This figure illustrates the odds ratio and 95% confidence intervals of the association between parity and macrosomia using GLMM. GLMM = Generalized linear mixed models. # Model adjustments: model1: adjusted for gestational age and sex of infants. Model 2: adjusted for the variables in model 1 plus mother’s relevant characteristics, including mother’s age, education level, occupation and gestational diabetes. Model 3: adjusted for the variables in model 2 and for status of family characteristics (including economic conditions, region and residence)

