Table 2.
SAR and properties of N-substituted analogues of compound 3.
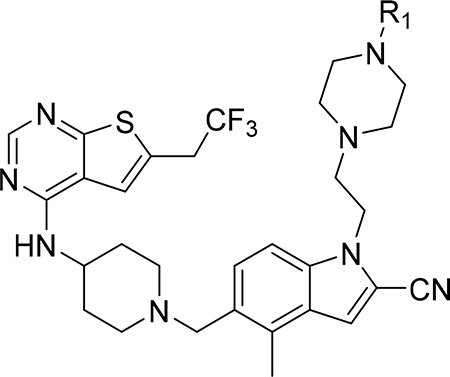 | |||||
|---|---|---|---|---|---|
| Compound | R1 | IC50 MLL4–43 (nM)a | GI50 (μM)b MLL-AF9 | T1/2 (min)c | cLogPd |
| 3 | H | 15 ± 4.9 | 0.40 | >60 | 4.3 |
| 8 |  |
13 ± 0.7 | 0.23 | 9.2 | 3.8 |
| 9 |  |
39 ± 2.1 | 1.0 | 12 | 4.9 |
| 10 | 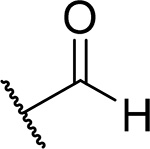 |
13 ± 4.2 | 0.15 | 21 | 4.1 |
| 11 | 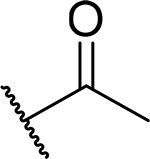 |
18 ± 3.5 | 0.15 | 13 | 4.2 |
| 12 | 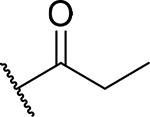 |
83 ± 2.8 | 0.25 | 13 | 4.8 |
| 13 (MI-853) | 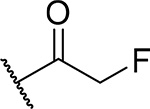 |
10 ± 0.7 | 0.075 | 5.7 | 4.5 |
| 14 |  |
44 ± 17 | 0.18 | 4.9 | 4.8 |
| 15 | 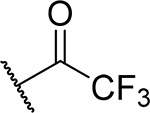 |
75 ± 22 | 0.23 | 14 | 5.4 |
| 16 |  |
57 ± 8.5 | 1.2 | 8.6 | 6.4 |
| 17 |  |
42 ± 2.8 | 0.75 | 10 | 6.9 |
| 18 (RS) | 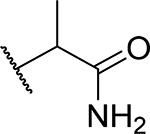 |
21 ± 4.2 | 0.25 | 11 | 3.2 |
| 19 | 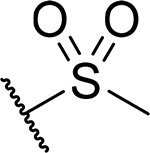 |
13 ± 2.8 | 0.15 | 26 | 4.7 |
| 20 | 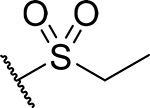 |
55 ± 15 | 0.25 | 19 | 5.2 |
| 21 | 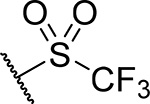 |
71 ± 7.1 | 0.45 | 15 | 5.8 |
| 22 | 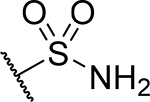 |
26 ± 2.1 | 0.22 | 53 | 4.7 |
| 23 | 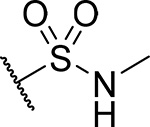 |
32 ± 1.4 | 0.15 | 24 | 4.4 |
IC50 values were measured by fluorescence polarization assay using fluorescein labeled MLL 4–43, average values from 2–3 independent measurements ± SD are provided.
Growth inhibition (GI50 values) measured in the MTT cell viability assay after 7 days of treatment of murine bone marrow cells transformed with MLL-AF9.
Half-life of compounds in mouse liver microsomes.
Calculated with ChemBioDraw Ultra 14.0.
