Table 3.
SAR and properties of N-substituted analogues of compound 4.
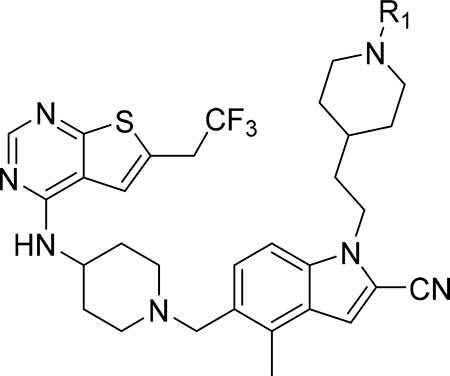 | |||||
|---|---|---|---|---|---|
| Compound | R | IC50 MLL4–43 (nM)a | GI50 (μM)b MLL-AF9 | T1/2 (min)c | cLogPd |
| 4 | H | 14 ± 1.4 | 0.81 | >60 | 5.5 |
| 24 | 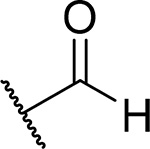 |
63 ± 2.1 | 0.57 | 25 | 4.6 |
| 25 | 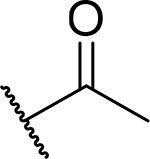 |
130 ± 32 | 0.97 | 26 | 4.6 |
| 26 | 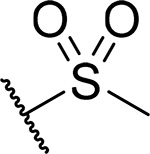 |
40 ± 9.2 | 0.25 | >60 | 5.2 |
| 27 | 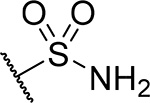 |
38 ± 10 | 0.35 | >60 | 5.6 |
IC50 values were measured by fluorescence polarization assay using fluorescein labeled MLL4–43, average values from 2–3 independent measurements ± SD are provided.
Growth inhibition (GI50 values) measured in the MTT cell viability assay after 7 days of treatment of murine bone marrow cells transformed with MLL-AF9.
Half-life of compounds in mouse liver microsomes.
Calculated with ChemBioDraw Ultra 14.0.
