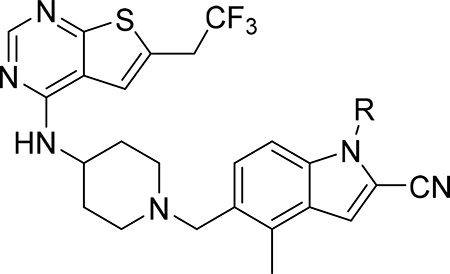
Table 4.
SAR and properties of enantiomers of compound 7.
 | ||||||
|---|---|---|---|---|---|---|
| Compound | R | IC50 MLL4–43 (nM)a | GI50 (μM)b MLL-AF9 | SI | T1/2 (min)c | cLogPd |
| 7 (RS) (MI-568) |  |
7.5 ± 2.1 | 0.05 | 180 | >60 | 3.7 |
| 28 (S) (MI-1481) |  |
3.6 ± 0.9 | 0.034 | >180 | 59 | 3.7 |
| 29 (R)(MI-1482) |  |
122 ± 22 | 0.7 | ND | >60 | 3.7 |
IC50 values were measured by fluorescence polarization assay using fluorescein labeled MLL 4–43, average values from 2–3 independent measurements ± SD are provided.
Growth inhibition (GI50 values) measured in the MTT cell viability assay after 7 days of treatment of murine bone marrow cells transformed with MLL-AF9.
Half-life of compounds in mouse liver microsomes.
Calculated with ChemBioDraw Ultra 14.0. SI, selectivity index calculated as a ratio of GI50 values measured in HM-2 cells (control cell line) and MLL-AF9 transformed murine bone marrow cells. ND – not determined.
