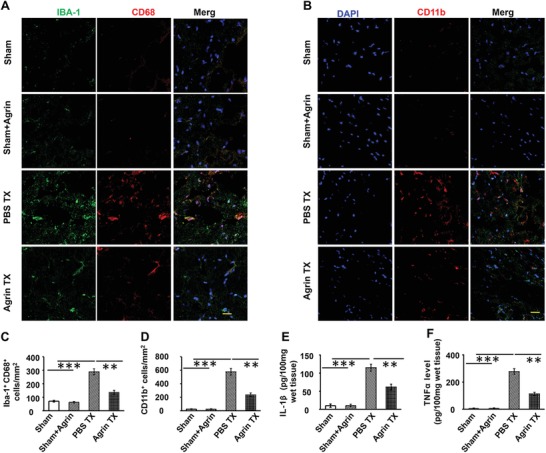
Figure 6.

The agrin treatment inhibiting inflammation in the penumbra. Representative CD68 and A) Iba‐1 double‐positive cells and B) CD11b+ inflammatory in the penumbra; scale bar, 20 µm. Quantitative analysis of CD68 and C) Iba‐1 double‐positive cells and D) CD11b+ inflammation in the penumbra (mean ± SD, n = 12, **p < 0.01, ***p < 0.001). E) IL‐1β levels and F) TNF‐α levels in the ischemic penumbra were determined by ELISA (mean ± SD, n = 6, **p < 0.01, ***p < 0.001).
