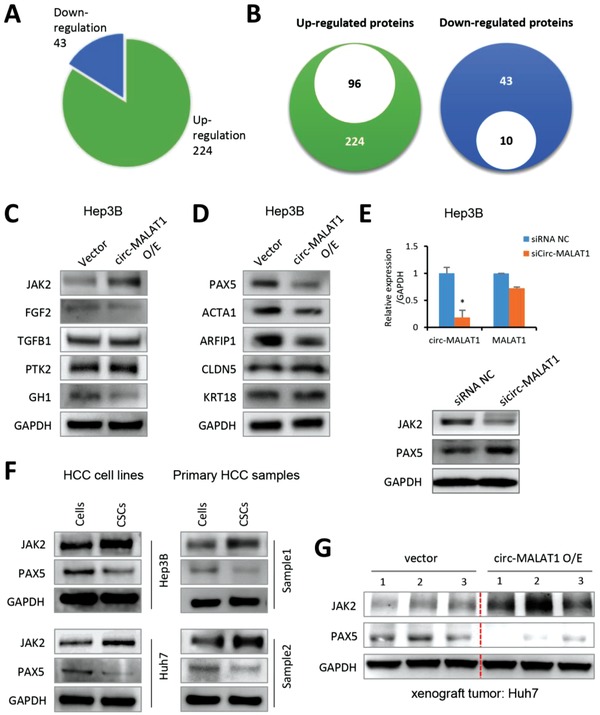
Figure 3.

Circ‐MALAT1 expression results in JAK2 and PAX5 Differential Expression. A) Pie chart showed that 224 proteins were upregulated and 43 were downregulated from protein microarray. Ratio of comparison at ≥1.8 or ≤1/1.8. B) Left panel, of the 224 upregulated proteins, 96 proteins were associated with CSCs self‐renewal or tumor metastasis and proliferation. Right panel, 10 of the 43 downregulated proteins were associated with tumor suppression. C) Five upregulated proteins from antibody‐array results were analyzed in Hep3B cells transfected with circ‐MALAT1 overexpression (circ‐MALAT1 O/E) or empty vector (Vector) by western blot analysis. D) Five downregulated proteins from antibody‐array results were analyzed in circ‐MALAT1 overexpression (circ‐MALAT1 O/E) or empty vector (Vector) cells by western blot analysis. E) Top panel, expression of circ‐MALAT1 and MALAT1 was analyzed by qRT‐PCR in Hep3B cells transfected with sicirc‐MALAT1 and siRNA NC. Bottom panel, protein expression of JAK2 and PAX5 was detected by western blot in circ‐MALAT1‐silenced‐Hep3B cells. siRNA NC, scramble control siRNA; sicirc‐MALAT1, siRNA against circ‐MALAT1. Columns, means from three independent experiments; bars, SD. * p < 0.05. F) Expression of JAK2 and PAX5 of CSCs and adherent cells of two HCC cell lines (left panel) Hep3B and Huh7 and two HCC primary cells (right panel) were detected by western blot. CSCs were enriched by the tumorsphere assay. G) JAK2 and PAX5 expressions were determined in the xenograft tumors by western blot.
