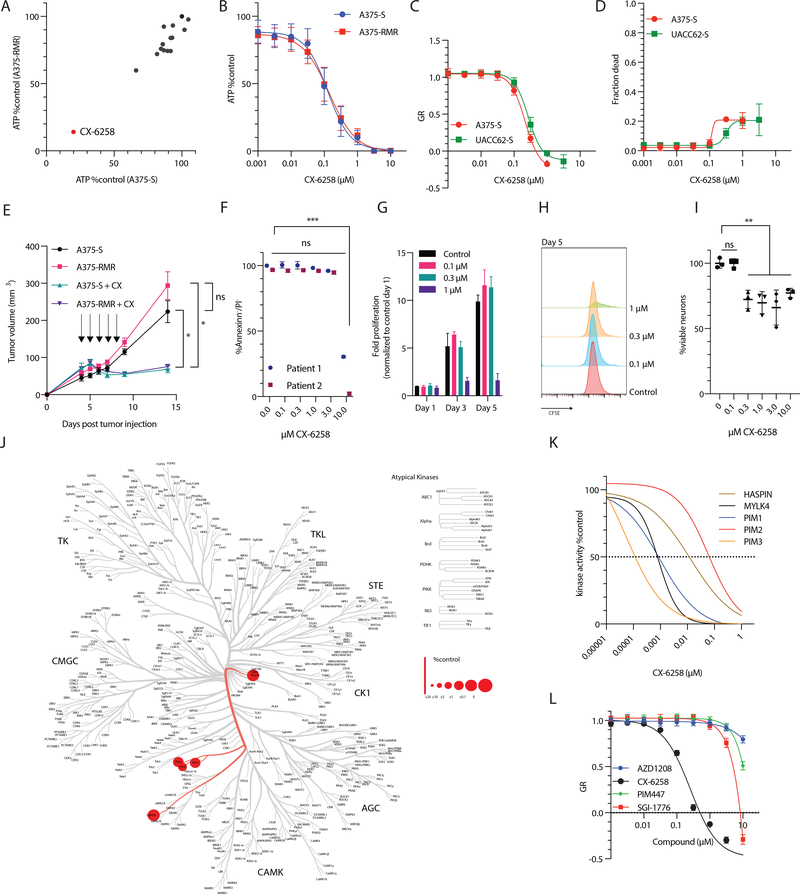
Figure 1:
(A) Summary of drug screen. Relative viability of melanoma cell lines A375-S (sensitive to RAF/MEK inhibitors) and A375-RMR (resistant to RAF/MEK-inhibitors) treated with a focused drug library (Supplementary Table 1). The x axis indicates the % viability of A375-S treated with the drug library compared to DMSO treatment; y axis indicates the % viability of A375-RMR treated with the drug library compared to DMSO treatment. Each compound in the library is indicated by a dot with a different color. CX-6258 is labeled separately. (B) Dose response curve of A375-S and A375-RMR. CX-6258 was given at doses indicated in x axis and viability was measured using ATP. The y axis indicates % viability of CX-6258 treated cells vs. DMSO treated cells. (C) Growth rate (GR) corrected effect of CX-6258 at different doses, x axis indicating μM of CX-6258, y axis indicating GR response of A375-S and UACC52-S and (D) fraction of dead cells withy axis indicating fraction of dead cells compared to vehicle treated cells. (E) Nude mice (n=5/group) were injected with A375-S or A375-RMR and treated with either CX-6258 or vehicle at days indicated by arrows. x axis indicates days since tumor injection, y axis indicates tumor volume (in mm3). Animals treated with CX-6258 had significantly smaller tumors compared to vehicle treated animals (n=5/group, Error bars, mean ± SEM. A375-S vs. A375-S + CX-6258, p= 0.02; A375-RMR vs. A375-RMR + CX-6258, p = 0.01, 2way ANOVA). (F) Annexin/PI staining of two human ex vivo expanded tumor-infiltrating lymphocytes (TILs) from melanoma Patient 1 and Patient 2 treated with DMSO or increasing doses of CX-6258 as indicated on the x axis; y axis shows the % of cells that are negative for both annexin and PI. (Error bars, mean ± SD. (***) adjusted p<0.001, ANOVA. (G) Proliferation of ex vivo expanded human tumor infiltrating lymphocytes (TILs) stimulated with CD3/CD28 in the presence of increasing doses of CX-6258. X axis days after stimulation, y axis fold expansion relative to control cells on day 1. Mean±SD. (H) Histograms of CFSE intensity dilution on day 5 of TILs compared to CFSE intensity on day 1, x axis indicating CFSE intensity (I) Human in vitro differentiated neurons were treated with CX-6258 at doses indicated on x axis, y axis indicating relative cell counts. Error bars, mean ± SD. DMSO vs. 0.1 μM, adjusted p-value > 0.99; DMSO vs. 0.3–10 μM, adjusted p-value=0.03–0.001, ANOVA). (J) Human kinome screen for CX-6258. The tree represents different families of human kinases. Red circles indicate kinases that are bound by CX-6258. The size of the circles indicates the binding of the compound relative to controls. (K) Dose-response inhibition for indicated targets by CX-6258 in vitro, x axis indicating molarity of CX-6258 and y axis indicating kinase activity in vitro. The dotted line represents IC50. (L) GR dose response in A375-S testing three functionally related compounds AZD1206, PIM447 and SGI1776 compared to CX-6258, x axis indicating doses in μM, y axis indicating GR response.

