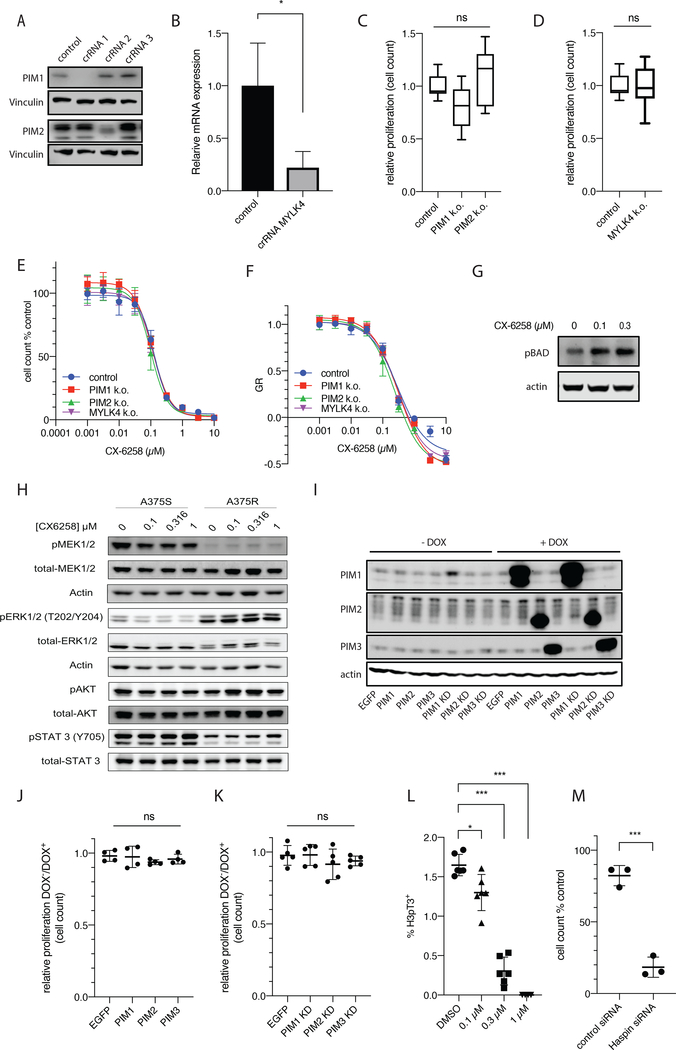
Figure 2.
(A) Western blots of PIM-1 and PIM-2 CRISPR-Cas9 KO. Cells were electroporated with ribonucleotides of Cas9 protein with indicated crRNAs or LacZ controls. (B) Relative mRNA expression of MYLK4 (y axis) in isogenic A375-S MYLK4 CRISPR-Cas9 KO vs. LacZ (p=0.0154, t-test). (C and D) Proliferation rate of PIM-1-KO and PIM-2-KO, and MYLK4-KO from (A) and (B) compared to their isogenic LacZ control cell lines (PIM1KO relative proliferation rate = 0.799, adjusted p value = 0.08 one-way ANOVA; PIM-2KO relative proliferation rate = 1.10, adjusted p value =0.47, one-way ANOVA). (E) Dose response of PIM-1-KO, PIM-2-KO, and MYLK4-KO cell lines from (A) and (B) to CX-6258 at doses (x axis, molarity) and in LacZ controls, with y axis indicating % cell number of CX-6258 treated cells compared to DMSO treated cells. (F) GR50 in response to CX-6258 (x axis, molarity) for all cell lines shown in E. The y axis indicates growth rate inhibition (G) Western blot of phosphorylated BAD (pBAD) and actin loading control in A375S cell lines treated with CX-6258 at indicated doses. (H) Western blot of total MEK1/2 and pMEK1/2, total ERK1/2 and pERK, total AKT and pAKT, and total STAT3 and pSTAT3, and actin controls, in A375-S and A375-RMR following treatment with indicated doses of CX-6258. (I) Western blots of PIM-1, PIM-2 and PIM-3 and actin loading controls in A375-S transduced with doxycycline-inducible vector for EGFP or ORFs for PIM-1, PIM-2, PIM-3 or kinase dead (KD) PIM-1-KD, PIM2-KD or PIM3-KD with (+Dox) or without (-Dox) doxycycline treatment. (J and K) Proliferation rate of A375-S overexpressing PIM-1, PIM-2 or PIM-3 or matched KD cell lines compared to EGFP-overexpressing cells relative to parental controls with +Dox (p=0.56 and 0.47, ANOVA). (L) Frequency (in % of all cells) of cells with positive Histone-3 phospho-Threonine 3 (H3pT3) staining (y axis) in A375-S cells treated with DMSO or indicated doses of CX-6258 showing a significant, dose-dependent reduction in response to CX-6258 treatment (Error bars, mean ± SD, p-value<0.001, linear trend significant, ANOVA). (M) Fraction of cell numbers in % of parental A375 cells (y axis) following treatment with a non-targeting siRNA or HASPIN targeting siRNA 48 hours after transfection (Error bars, mean ± SD. p-value<0.0001, t-test).

