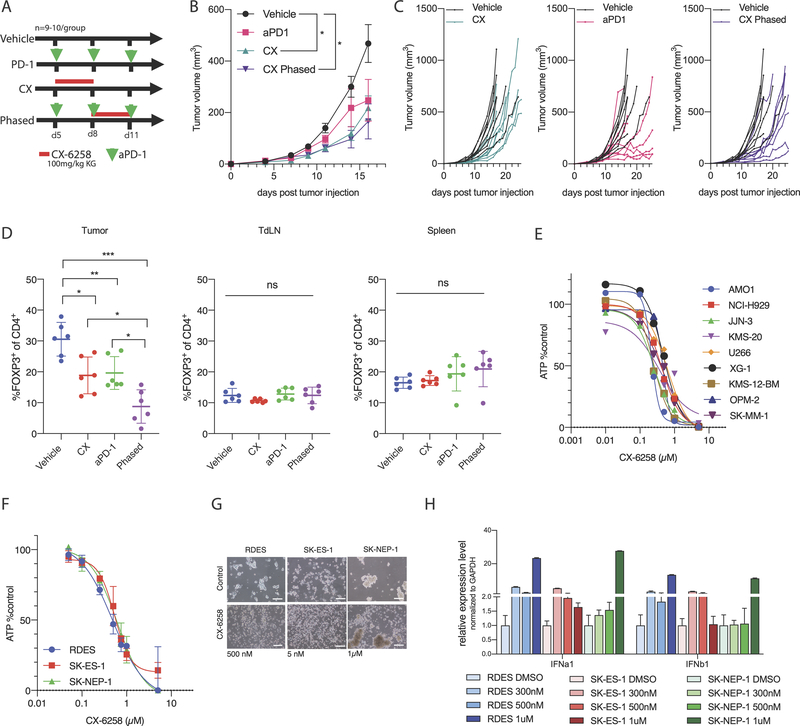
Figure 4.
(A) Study design for in vivo in BALB/c mice implanted with CT26 tumors. Green arrow heads indicate days after tumor injection (D5, D8 and D11) animals were treated with intraperitoneally (IP) administered anti-PD-1 antibody; the red bar indicates days animals were treated with CX-6258 by oral gavage. Top group were treated with vehicle controls, second with anti-PD-1 alone, third with CX-6258 alone and the last group was treated with a phased combination of anti-PD-1 and CX-6258. N=8 animals/group. (B) Growth curves of animals treated per design in (A), x axis indicating days since tumor injection and y axis indicating tumor volume in mm3.( Error bars, mean ± SEM. Vehicle vs. CX, adjusted p-value=0.02; vehicle vs. aPD-1, adjusted p-value=0.36; vehicle vs. phased, adjusted p-value=0.002, 2way ANOVA), (C) Growth curves of individual animals treated per design in Figure 4A, x axis indicating days since tumor injection and y axis indicating tumor volume in mm3. (D) Flow-cytometry analysis of lymphocytes of animals implanted with CT26 tumors and treated as per treatment scheme in Figure S4E, x axis indicating different treatment groups, and y axis indicating % of FOXP3 positive cells of all CD4+ cells in tumor, tumor-draining lymph nodes (tdLN) and spleens. Analysis of N=6 animals/group. Error bars, mean ± SD. p-value<0.001, ANOVA). (E) Multiple myeloma cell lines (names indicated on the right) treated with CX-6258, x axis indicating doses used in μM, y axis indicating % of ATP levels per CellTiterGlo assay compared to DMSO treated control. (F) Ewing sarcoma cell lines (names indicated in bottom left) treated with CX-6258, x axis indicating doses used in μM, y axis indicating % of ATP activity per CellTiterGlo assay compared to DMSO treated control. (G) Impact of CX-6258 treatment (right) vs. DMSO (left) on spheroid formation of Ewing sarcoma cell lines shows variable responses. Scale bar represents 200 μm. (H) Relative expression of IFNa1 and IFNb1 mRNA in Ewing sarcoma cell lines treated with increasing doses of CX-6258 (indicated by color gradient as defined at the bottom of the graph), y axis relative gene expression normalized to DMSO control in each cell line.

