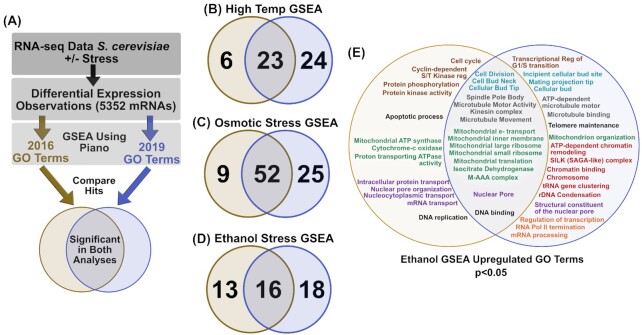
Figure 3.
Gene set enrichment analysis results change over time. (A) DE data (RNA-seq) from Lahtvee 2016 was analyzed for enriched gene sets among either 2016 GO terms (gold) or 2019 GO terms (blue). Analysis utilized the piano R-package and included gene sets with 2 to 400 genes. (B–D) Significantly enriched GO term overlap is shown between the two analyses for gene sets that were upregulated(E). Upregulated GO terms for ethanol stress were grouped using text color based on similarity. GO terms shown in black were not placed into groups.

