Figure 2.

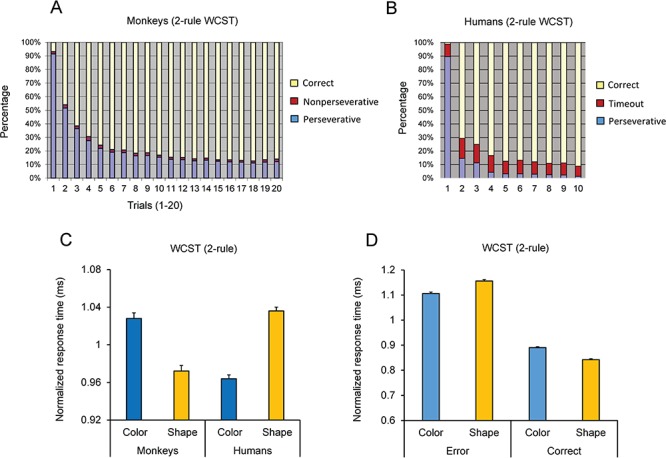
Performance of monkeys and humans in the 2-rule version of the WCST. (A) The mean percentage of correct, perseverative, and non-perseverative responses are shown in trials after the rule shift for 21 monkeys. Trial 1 is the first trial after the rule shift. Note that after the rule shift, monkeys’ correct responses dropped to a very low value; however, they adapted to the new rule achieved more than 70% correct in the fifth trial. Note that although a different sample was shown (until all the 36 samples were run) in each trial after the rule shift (no repetition of samples), the monkeys could shift to the new rule after a few trials. (B) The mean percentage of correct, perseverative, and time-out trials are shown in trials after the rule shift for 55 humans. (C) Normalized response time of correct responses was calculated in each subject by dividing the response time in each condition by the mean response time for all conditions in each subject. (D) Mean normalized response time is shown for perseverative and correct trials in monkeys performing the 2-rule version of the WCST. Response time was longer in perseverative error trials and shorter in correct trials when shape dimension was relevant. This led to a larger error slowing (difference in response time between error and correct trials) when shape was the relevant dimension. Error bars represent the standard error of the mean in all figures.
